Moderating effect of the policy and regulatory environment on the relationship between resource management strategies and organizational performance of donor funded HIV programmes in Kenya: a cross-sectional study
Mercy Njura Njeru
Corresponding author: Mercy Njura Njeru, Chandaria School of Business, United States International University Africa, Nairobi, Kenya 
Received: 06 Jun 2026 - Accepted: 27 Sep 2026 - Published: 12 Nov 2026
Domain: Health system development
Keywords: HIV infections, workforce, financial management, information technology, policy, government
Funding: This work received no specific grant from any funding agency in the public, commercial, or non-profit sectors.
©Mercy Njura Njeru et al. Pan African Medical Journal (ISSN: 1937-8688). This is an Open Access article distributed under the terms of the Creative Commons Attribution International 4.0 License (https://creativecommons.org/licenses/by/4.0/), which permits unrestricted use, distribution, and reproduction in any medium, provided the original work is properly cited.
Cite this article: Mercy Njura Njeru et al. Moderating effect of the policy and regulatory environment on the relationship between resource management strategies and organizational performance of donor funded HIV programmes in Kenya: a cross-sectional study. Pan African Medical Journal. 2026;55:118. [doi: 10.11604/pamj.2026.55.118.53792]
Available online at: https://www.panafrican-med-journal.com//content/article/55/118/full
 PDF in process
Research 

Moderating effect of the policy and regulatory environment on the relationship between resource management strategies and organizational performance of donor funded HIV programmes in Kenya: a cross-sectional study
Moderating effect of the policy and regulatory environment on the relationship between resource management strategies and organizational performance of donor funded HIV programmes in Kenya: a cross-sectional study
 Mercy Njura Njeru1,&
&Corresponding author
Introduction: donor-funded HIV programme performance may depend on the policy and regulatory context in which resources are managed. This study examined whether the policy and regulatory environment moderates the association between resource management strategies and organizational performance in these programmes in Kenya.
Methods: a cross-sectional survey was conducted in 2025 among 404 senior managers of donor-funded HIV programmes in 40 counties, selected by stratified random sampling. A questionnaire measured human resource, financial, physical and information technology resource management, the policy and regulatory environment and self-reported organizational performance. Analysis used correlation, linear regression and moderated regression.
Results: of 404 questionnaires, 285 were analysed (response rate 70.5%). Scales were reliable (Cronbach alpha 0.765 to 0.904); constructs were rated moderately (composite means 2.89 to 3.09). Organizational performance was correlated with human resource (r = 0.387), financial (r = 0.383) and information technology (r = 0.424) resource management, but not with physical resource management (r = 0.108; p = 0.070). The strategy x policy product term was positive and significant in all four models (b = 0.420 to 0.622; all p < 0.001). Adding the four product terms to a main-effects model increased R2 from 0.405 to 0.513 (F(4, 275) = 15.2; p < 0.001).
Conclusion: the association between resource management strategies and self-reported organizational performance was stronger where managers rated the policy and regulatory environment favourably and near zero where they rated it unfavourably. Harmonized, operationally embedded compliance systems merit evaluation using longitudinal designs and objective indicators.

Human immunodeficiency virus (HIV) remains a major public health challenge, and the gains achieved through donor-supported treatment and prevention programmes depend not only on financing, but also on how effectively resources are governed and translated into service delivery results. Global monitoring reports continue to show that health workforce capacity, financial discipline, and regulatory coherence are central to sustaining universal health coverage and HIV programme performance [1,2]. In Kenya, donor-funded HIV programmes operate within a layered governance environment shaped by national policy, county mandates, and donor accountability rules, creating conditions in which performance depends on both internal management and external regulation [3-7]. This is particularly relevant for programmes that rely on multiple resource streams, including human, financial, physical, and information technology resources, each of which is subject to distinct compliance requirements and operational constraints [8-10]. The Resource-Based View holds that organizations perform better when they deploy valuable, rare, inimitable, and non-substitutable resources effectively [11,12]. In public and donor dependent health systems, however, the value of resources is not fixed; it is shaped by the institutional environment in which those resources are used. Dynamic capabilities theory further suggests that organizations must continuously integrate and reconfigure their resources in response to changing conditions [13,14], while institutional perspectives emphasize that formal rules, compliance requirements, and enforcement mechanisms determine whether resource investments become productive capabilities or remain underutilized assets [15,16]. Related work on public health management reinforces the view that strategic change depends on an organization´s ability to align resources with evolving operational constraints [17-21]. In donor funded HIV programming, this means that the same workforce, budget, infrastructure, or technology may produce different performance outcomes depending on whether the policy and regulatory environment is enabling, fragmented, or restrictive [6,7,16].
Empirical evidence from Kenya and comparable settings shows that resource-performance relationships are frequently conditioned by regulatory structures. Human resource management in Kenyan health systems is shaped by licensing rules, deployment frameworks, payroll arrangements, and county-level implementation capacity [3]. Transitioning HIV staff from donor contracts to government systems has likewise shown that workforce stability is strongly influenced by regulatory alignment and employment policy coherence [4]. Global evidence further demonstrates that physical infrastructure remains a critical determinant of development and service delivery outcomes, particularly where infrastructure investments are supported by effective governance and maintenance systems [22]. Similarly, financial and physical resources contribute more effectively to performance when procurement, reporting, accountability mechanisms, and financial governance systems are clear and consistent [8,9,23]. Evidence from emerging economies further suggests that the effective management of intellectual and financial resources contributes significantly to organizational performance, reinforcing the importance of sound resource stewardship and accountability systems [24]. This gap is important in Kenya because donor funded HIV programmes remain central to service delivery, yet their performance is shaped by a complex mix of donor policies, national regulations, and organizational practices.
Evidence from Kenyan health sector studies indicates that fragmentation, inconsistent enforcement, and unclear policy communication can weaken the translation of resources into results, even where funding and infrastructure are available [3,6,7,20]. At the same time, programmes that align workforce deployment, financial controls, and digital systems with regulatory requirements are better positioned to achieve continuity, accountability, and sustainability [5,17,18]. The present study therefore examined the moderating effect of the policy and regulatory environment on the relationship between resource management strategies and organizational performance of donor-funded HIV programmes in Kenya. The focus was on whether policy conditions strengthen or weaken the performance contribution of human, financial, physical, and information technology resource management strategies, both individually and in combination. The study is practically significant because donor-funded HIV programmes must often respond to competing expectations from donors, national ministries, and county governments. Where rules are clear and aligned, resource management can translate more smoothly into service outcomes; where rules are fragmented or inconsistently enforced, even well-resourced programmes can underperform. The study therefore provides evidence to inform policy coordination, operational planning, and programme governance in a high-burden health system context.
Study objective and research questions: the objective of this study was to quantify the statistical association between four resource management strategies: human resource, financial, physical, and information technology resource management, and self-reported organizational performance among donor-funded HIV programmes in Kenya, and to test whether that association differs according to how managers rate the policy and regulatory environment. Three questions were addressed: 1) at what level are the four resource management strategies, the policy and regulatory environment, and organizational performance implemented and rated by senior managers? ii) is the product of each resource management strategy and the policy and regulatory environment associated with organizational performance in a moderated regression model? and iii) how does the association between each resource management strategy and organizational performance differ across levels of the policy and regulatory environment?

Study design: this study used a cross-sectional, non-experimental correlational design, in which all data were collected from each respondent at a single point in time during 2025. The design is appropriate for describing existing management practices and for quantifying their statistical association with rated performance, but it cannot establish the temporal order of the variables and cannot support causal inference; the associations reported below, including the moderation results, are therefore described throughout as associations rather than as effects. The study is reported in accordance with the Strengthening the Reporting of Observational Studies in Epidemiology (STROBE) statement [25].
Study setting and population: the study was conducted in 2025 among donor-funded HIV programmes operating in 40 of Kenya´s 47 counties that receive external HIV support; the remaining seven counties do not host the donor-supported programme structures from which the sampling frame was drawn and were not represented. The target population comprised 4,488 senior programme managers working in implementing partner organizations, county HIV coordination structures and donor-supported health facilities. For this study a senior programme manager was defined as a person holding direct responsibility for programme planning, resource allocation, implementation, supervision, monitoring or reporting within a donor-funded HIV programme, and therefore positioned to describe both the management practices in place and the performance of the programme; staff without such responsibility, and managers of programmes not receiving donor HIV support, were not eligible. The sampling frame was assembled from the staffing lists of donor-supported programme structures in the 40 counties.
Unit of analysis and unit of observation: the individual senior programme manager was both the unit of observation and the unit of analysis. Every variable was derived from an individual manager´s questionnaire responses, and no responses were aggregated to the programme level. Because the number of distinct programmes represented among the 285 respondents was not recorded, the observations are treated as independent individual responses; the implications for standard errors are addressed under Statistical Methods.
Sample size: the minimum sample size was calculated using Yamane´s formula for a finite population [26]:
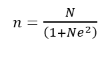
Where n is the minimum required sample size, N is the target population size (4,488 senior programme managers), and e is the margin of error (0.05, corresponding to a 95% confidence level). Substituting these values gave n = 4,488 / (1 + 4,488 × 0.052) = 4,488 / 12.22 = 367.3, which was rounded to a minimum of 367 completed questionnaires. The formula assumes simple random sampling and maximum variability (p = 0.5) and makes no allowance for a design effect; none was applied. Allowing 10% for non-response, 404 questionnaires were distributed.
Sampling procedure: stratified random sampling was used, with implementing partner organizations, county HIV coordination structures and donor-supported health facilities forming the three strata; respondents were allocated in proportion to the eligible managers each stratum contributed to the frame and selected at random within strata. The frame comprised 57 implementing partner mechanisms with 114 eligible managers (2.5%), 40 donor-supported counties with 80 managers (2.0%), and 2,147 donor-supported health facilities with 4,294 managers (95.5%), giving an allocation of 9, 6 and 394 questionnaires respectively. Because facilities account for 95.5% of eligible managers, a proportionate sample is necessarily dominated by facility-based respondents. The achieved number per stratum was not documented, and the survey recorded facility ownership rather than stratum.
Data collection: data were collected in 2025 using a structured, self-administered questionnaire comprising socio-demographic items and 110 statements measuring human resource management (25 statements), financial resource management (20), physical resource management (20), information technology resource management (15), the policy and regulatory environment (10) and organizational performance (20). All statements were rated on a five-point Likert scale from 1 (strongly disagree) to 5 (strongly agree), so that a higher score denotes stronger agreement. The same administration procedures were used at all participating sites; participation was voluntary, and anonymity and confidentiality were assured.
Instrument development, validity and reliability: the questionnaire was newly developed for this study rather than adapted from a validated instrument. Items were written from the resource-based, dynamic capabilities and health management literature [11-17,21] and mapped to the study constructs. Content and face validity were addressed through review by the supervising academic team and a pilot study in four purposively selected counties (Kiambu, Nairobi, Kitui and Machakos) excluded from the main frame, in which 34 of 40 questionnaires were completed, and item wording was revised. Internal consistency was assessed on the pilot data using Cronbach´s alpha, and construct validity by exploratory factor analysis on the analytic sample using the Kaiser-Meyer-Olkin measure and Bartlett´s test of sphericity; both are reported in the Results. Alpha was computed on the pilot sample of 34 rather than the analytic sample, and confirmatory factor analysis was undertaken.
Variables and measurement: the four explanatory variables were human resource, financial, physical and information technology resource management strategies. The policy and regulatory environment, covering donor policy requirements, contractual and audit compliance, government influence on budgeting, staffing, procurement and reporting, national data and ethical standards, and the communication of policy updates, was the moderating variable. The outcome was organizational performance, defined as senior managers´ assessment of how well their programme supports its workforce, uses resources efficiently, operates through country systems and delivers results for clients, measured by statements across four domains of five items each: employee satisfaction, efficiency, country ownership and patient outcomes. Each construct was scored as the unweighted mean of its items, retaining the 1 to 5 metric. Organizational performance is therefore a perception-based composite: no objective indicators, such as viral load suppression, ART initiation, retention in care or reporting completeness, were abstracted from routine information systems, and the outcome should not be read as verified programme results.
Missing data: questionnaires that were not returned were treated as non-response and are reported as such. All 285 returned questionnaires were complete: there were no missing responses on any of the 110 items, so no imputation was required and the analysis is a complete-case analysis of the full analytic sample.
Statistical methods: data were analysed using SPSS version 29. Descriptive statistics summarized respondent characteristics and item and composite scores. Each construct was analysed as a multi-item composite rather than as single ordinal items; the supporting factor analyses confirmed that each scale was dominated by a single component. Pearson correlation and simple linear regression quantified the bivariate association between each strategy and organizational performance, and a multiple regression containing all four strategies and the policy variable was estimated as a main-effects model. Moderation was tested by regressing organizational performance on a strategy, the policy and regulatory environment, and their product term [27]; four such models were estimated, together with a joint model containing all four strategies, the policy variable and all four product terms. Because the main-effects and joint models are nested, the change in R2 attributable to the four product terms and its F test are reported; the equivalent change for each individual model could not be computed, as the corresponding two-predictor models were not estimated. Predictors were entered in their original 1 to 5 metric and were not mean-centred, so the coefficients for the constituent variables are conditional estimates at zero, a point outside the observed range, and each product term is collinear with its constituents. Coefficients are unstandardized and reported with standard errors, t statistics, p values and 95% confidence intervals (±1.968 standard errors on 281 degrees of freedom for the moderated models, and on 283 degrees of freedom for the single-predictor models); because the dispersions of the four composites differ, they are not comparable across models. Conditional slopes were derived at fixed values of the moderator [27,28]. Regression assumptions were tested and are reported in the results. No covariates were included, so all estimates are unadjusted. Respondents were treated as independent observations: the study was neither designed nor powered for multilevel analysis and the required identifiers were not retained, so standard errors may be underestimated and p values correspondingly too small. Significance was assessed at p < 0.05, two-sided.
Bias: several sources of bias were considered, and no claim is made that any was eliminated. Stratified random selection was intended to limit selection bias, but the achieved sample was dominated by managers in Ministry of Health facilities. Of the 404 questionnaires distributed, 119 (29.5%) were not returned, and no characteristics were recorded for those managers, so non-response bias could not be assessed; managers who are more engaged or more confident about performance may have been more likely to participate, which would tend to inflate the ratings reported. The explanatory, moderating and outcome variables were all reported by the same respondents on one instrument, so part of the observed association may reflect common-method variance [29]; the only safeguards applied were anonymity, confidentiality, voluntary participation and standardized administration, with no statistical remedy. Managers were reporting on their own organizations and may have given more favourable ratings than an independent assessment would produce. Information bias is likely limited by the use of a standardized, pilot-tested instrument administered identically at all sites.
Ethical considerations: ethical approval was obtained from the United States International University-Africa Institutional Review Board (USIU_A/ISERC/US987-2025) and a research permit was granted by the National Commission for Science, Technology and Innovation (NACOSTI/P/25/4177314). Participation was voluntary, informed consent was obtained from all respondents, and confidentiality was maintained throughout the study.
Participants: of the 404 questionnaires distributed across 40 counties in Kenya, 285 were completed and analysed, a response rate of 70.5%; the remaining 119 (29.5%) were not returned, and no information was recorded for those managers. Male respondents numbered 169 (59.3%) and female respondents 116 (40.7%). By age, 89 respondents (31.2%) were recorded as 25 to 35 years, 66 (23.2%) as 35 to 44, 58 (20.4%) as 18 to 25, 45 (15.8%) as 48 to 54 and 27 (9.5%) as older than 54; the recorded categories are not mutually exclusive at their boundaries, so this distribution should be read as approximate. On educational attainment, 142 (49.8%) held a university or college degree, 64 (22.5%) a master´s degree, 64 (22.5%) a diploma and 15 (5.3%) a doctoral qualification. On managerial experience, 101 (35.4%) had served five to ten years, 84 (29.5%) less than five, 52 (18.2%) eleven to fifteen, 29 (10.2%) fifteen to twenty and 19 (6.7%) more than twenty. By affiliation, 203 (71.2%) were based in Ministry of Health facilities, 53 (18.6%) in faith-based facilities and 29 (10.2%) in private-for-profit facilities. Respondents were therefore predominantly mid-career, highly educated managers working within public-sector HIV service delivery structures. These characteristics were collected to describe the achieved sample and were not entered into the regression models, which are unadjusted throughout; facility ownership in particular could plausibly shape perceptions of policy, resource management and performance simultaneously. The predominance of facility-based managers is what proportionate sampling from this frame produces, since facilities account for 4,294 of the 4,488 eligible managers. Subgroup analyses by county, region or ownership were not undertaken, the study being neither designed nor powered for subgroup inference and the two smaller ownership groups containing 53 and 29 respondents.
Descriptive analysis: composite scores for the six constructs are summarized in Table 1. All six were rated at a moderate level on the five-point scale, within a narrow band from 2.89 to 3.09: financial resource management recorded the highest composite mean (3.09), followed by information technology resource management (3.08), human resource management (2.99), the policy and regulatory environment (2.95) and physical resource management (2.89). Self-reported organizational performance had a composite mean of 2.98 (SD 0.90). Within every construct, however, individual item means ranged widely, from as low as 2.16 to as high as 3.75, so the moderate composite scores conceal substantial variation between specific practices; item standard deviations ranged from 1.11 to 1.40, indicating that respondents also differed considerably from one another on almost every item. Standard deviations for the composite scores other than organizational performance were not generated and are not reported. The item-level results for each construct are given in Table 2, Table 3 and Table 4 and summarized below. Within human resource management (Table 2, composite mean 2.99), the highest ratings were recorded for salary competitiveness (M = 3.747, SD = 1.184), retention support for hard-to-staff sites (M = 3.709, SD = 1.111) and peer support and mentorship initiatives (M = 3.691, SD = 1.179), while competency-based recruitment panels (M = 2.179, SD = 1.153), shared targets and programme dashboards (M = 2.474, SD = 1.209), prompt redeployment procedures (M = 2.498, SD = 1.321) and appraisal-linked development plans (M = 2.537, SD = 1.254) received the lowest. Financial resource management (Table 2, composite mean 3.09) showed relatively high ratings for timely release of funds (M = 3.695, SD = 1.173), stakeholder involvement in planning (M = 3.639, SD = 1.165) and ease of accessing funds (M = 3.639, SD = 1.195), whereas budgetary discipline (M = 2.158, SD = 1.163), communication to stakeholders of the rationale and criteria for allocation (M = 2.312, SD = 1.197), implementing units´ understanding of requirements and timelines (M = 2.316, SD = 1.207) and the adequacy of funding for planned outputs (M = 2.386, SD = 1.177) were rated lowest.
For physical resource management (Table 2, composite mean 2.89, the lowest of the four strategies), routine facility inspection and hygiene maintenance (M = 3.705, SD = 1.221), clear signage and wayfinding (M = 3.600, SD = 1.114) and transport accessibility (M = 3.498, SD = 1.215) were the highest-rated aspects, while routine assessment of space adequacy and functionality (M = 2.175, SD = 1.203), scheduled maintenance and upgrades (M = 2.263, SD = 1.212), the translation of improved physical access into service outcomes (M = 2.309, SD = 1.211) and dedicated resources for maintenance (M = 2.312, SD = 1.206) were the lowest. In information technology resource management (Table 2, composite mean 3.08), respondents rated information retrieval (M = 3.719, SD = 1.195), improvements in data completeness and accuracy (M = 3.639, SD = 1.169) and interoperability with national and county health information systems (M = 3.618, SD = 1.249) most favourably, while system reliability and freedom from unplanned outages (M = 2.340, SD = 1.199), availability of responsive technical support (M = 2.379, SD = 1.263) and the contribution of system integration to coordination (M = 2.323, SD = 1.284) were rated lowest. The policy and regulatory environment (Table 3, composite mean 2.95) was the most uniformly rated construct in the instrument: all ten item means fell between 2.846 and 3.021, a range of less than one fifth of a scale point. The highest-rated items were the systematic alignment of programme activities with donor policy requirements (M = 3.021, SD = 1.201) and the implementation of national data standards, confidentiality and ethical requirements (M = 3.011, SD = 1.179), while the embedding of donor contract terms on cost allowability, procurement and reporting into operational procedures (M = 2.846, SD = 1.180), the clear and consistent communication of donor policy frameworks (M = 2.877, SD = 1.152) and the communication of updates in government guidance to staff (M = 2.888, SD = 1.211) were rated lowest. The pattern is one in which formal alignment with external requirements is acknowledged more readily than the internal embedding and timely communication of those requirements, although the differences between items are small relative to the dispersion of responses (item standard deviations 1.152 to 1.214).
Organizational performance: self-reported organizational performance was measured by 20 statements across four domains (Table 4). The composite score had a mean of 2.98 and a standard deviation of 0.90 on the five-point scale (n = 285). Ratings were uniformly mid-scale and the four domains were closely spaced: patient outcomes recorded the highest domain mean (3.01), followed by efficiency (3.01), country ownership (2.96) and employee satisfaction (2.92). Item means occupied a narrow range from 2.877 to 3.070, while item standard deviations ranged from 1.228 to 1.395, the widest dispersion recorded for any construct in the instrument; respondents were therefore markedly divided about the performance of the programmes they manage, and the mid-scale composite reflects the balance between opposed groups of respondents rather than a shared perception of moderate performance. The highest-rated individual items concerned the monitoring and active tracing of missed appointments and loss to follow-up (M = 3.070, SD = 1.246), viral load testing coverage and suppression (M = 3.046, SD = 1.306) and the contribution of standard operating procedures to completing tasks within expected timelines (M = 3.039, SD = 1.395); the lowest concerned the clarity and manageability of job roles and workload (M = 2.877, SD = 1.263), supportive supervision (M = 2.912, SD = 1.257) and support for work-life balance (M = 2.923, SD = 1.340). All 20 items are self-reported: the patient-outcome items record managers´ assessments of clinical and programmatic results rather than the results themselves, and internal consistency coefficients for the scale were not computed.
Reliability, construct validity and model assumptions: all six scales showed acceptable internal consistency on the pilot data, with Cronbach´s alpha ranging from 0.765 for physical resource management to 0.904 for the policy and regulatory environment (Table 5). Exploratory factor analysis on the analytic sample confirmed that every correlation matrix was suitable for factoring (Kaiser-Meyer-Olkin 0.869 to 0.977; Bartlett´s test significant throughout, p < 0.001) and that each scale was dominated by a single component accounting for 46.1% to 54.1% of variance, with no second eigenvalue above 1.0. Regression assumptions were also tested. Residuals were consistent with normality in all four models (Shapiro-Wilk W = 0.985 to 0.994, p = 0.051 to 0.293; Kolmogorov-Smirnov D = 0.037 to 0.049, p = 0.509 to 0.835), and Durbin-Watson statistics of 2.087 to 2.121 indicated no first-order autocorrelation. Constant error variance was supported in the financial, physical and information technology models on both the Breusch-Pagan and White tests (all p > 0.39). In the human resource management model the White test gave no evidence of heteroscedasticity (χ2= 7.137, p = 0.068) but the Breusch-Pagan test was significant (χ2 = 4.757, p = 0.029), so some dependence of residual variance on fitted values cannot be excluded there. The variance inflation factors of 1.00 obtained in the bivariate models are arithmetically inevitable in a single-predictor regression and carry no information about collinearity in the moderated models.
Association between each resource management strategy and organizational performance: before the moderation analysis, the bivariate association between each resource management strategy and organizational performance was quantified (Table 6). Information technology resource management showed the strongest association (r = 0.424; unadjusted b = 0.4117, 95% CI: 0.309 to 0.514; R2= 0.180; p < 0.001), followed by human resource management (r = 0.387; b = 0.4028, 95% CI:0.291 to 0.515; R2= 0.150; p < 0.001) and financial resource management (r = 0.383; b = 0.4177, 95% CI: 0.300 to 0.536; R2= 0.146; p < 0.001). Physical resource management was not significantly associated with organizational performance (r = 0.108; b = 0.110, 95% CI: -0.008 to 0.228; R2= 0.012; p = 0.070). In a multiple regression containing all four strategies and the policy and regulatory environment as main effects (R2= 0.405, adjusted R2= 0.394, F(5, 279) = 37.98, p < 0.001), the coefficients for human resource management (b = 0.332, p < 0.001), financial resource management (b = 0.351, p < 0.001) and information technology resource management (b = 0.351, p < 0.001) remained significant, while those for physical resource management (b = 0.049, p = 0.30) and the policy and regulatory environment (b = -0.001, p = 0.98) did not. That the policy variable has essentially no main effect on organizational performance, while its product terms are significant, is consistent with its acting as a moderator of the resource-performance association rather than as a determinant of performance in its own right.
Moderated regression analysis: four moderated regression models were estimated, one for each resource management strategy, each containing the strategy, the policy and regulatory environment and their product term, together with a joint model containing all four strategies, the policy variable and all four product terms (Table 7). Each individual model was estimated on three predictors and 281 residual degrees of freedom and was statistically significant: human resource management (R2= 0.375, adjusted R2= 0.369, F(3, 281) = 56.25), information technology resource management (R2= 0.333, adjusted R2= 0.326, F(3, 281) = 46.79), financial resource management (R2= 0.298, adjusted R2= 0.291, F(3, 281) = 39.82) and physical resource management (R2= 0.121, adjusted R2= 0.112, F(3, 281) = 12.92); all p < 0.001. Each figure is the variance accounted for by the whole model, including the constituent variables, and is not a measure of the strength of the moderation. The appropriate statistic is the change in R2attributable to the product terms, which can be computed for the joint model. Adding the four product terms to the main-effects model raised R2from 0.405 to 0.513, an increase of 0.108, F(4, 275) = 15.2 (p < 0.001); the joint model was significant overall (adjusted R2= 0.497, F(9, 275) = 32.13, p < 0.001). The equivalent figure could not be computed for the individual models, as the corresponding two-predictor models were not estimated. The regression coefficients for the four individual models are presented in Table 7. The product term was positive and statistically significant in every model: human resource management × policy (b = 0.6217, SE = 0.0623, 95% CI: 0.4991 to 0.7443, t = 9.97), financial resource management × policy (b = 0.5408, SE = 0.0704, 95% CI: 0.4022 to 0.6794, t = 7.68), information technology resource management × policy (b = 0.4825, SE = 0.0610, 95% CI: 0.3624 to 0.6026, t = 7.91) and physical resource management × policy (b = 0.4195, SE = 0.0744, 95% CI: 0.2730 to 0.5660, t = 5.64); all p < 0.001.
These are unstandardized coefficients estimated in separate models on composites of differing dispersion, with substantially overlapping confidence intervals, so they do not rank the four domains. The coefficients for the constituent variables were negative in all four models, for example human resource management b = -1.4839 and the policy variable b = -1.8673 in the human resource management model; because the predictors were not mean-centred these are conditional estimates at zero, which lies outside the observed 1 to 5 range, and are not interpretable at the values reported. To express the moderation on an interpretable scale, the conditional slope of each strategy on organizational performance was derived at three fixed values of the policy and regulatory environment score [27,28]. At a policy rating of 4 the conditional slopes were 1.00 for human resource management, 0.92 for financial resource management, 0.86 for information technology resource management and 0.52 for physical resource management; at a rating of 3, close to the observed mean of 2.95, they were 0.38, 0.38, 0.38 and 0.10; and at a rating of 2 they were -0.24, -0.17, -0.10 and -0.32. The pattern is consistent across domains: the association between resource management and performance is positive and substantial where the regulatory environment is rated favourably, weak around the average rating, and close to zero or slightly negative where it is rated unfavourably. These are point estimates derived from the coefficients in Table 7; their standard errors require the covariance matrix of the estimates, which was not generated, so no significance test is attached to any individual slope. The four models indicate that the association between resource management strategies and self-reported organizational performance differs according to how managers rate the policy and regulatory environment, and is more strongly positive at more favourable ratings of that environment.
Principal findings: in this cross-sectional study of 285 senior managers of donor-funded HIV programmes in 40 Kenyan counties, all six constructs were rated at a moderate level, within a narrow band of composite means from 2.89 to 3.09, and self-reported organizational performance averaged 2.98 (SD 0.90). In each of four moderated regression models, the product of a resource management strategy and the policy and regulatory environment was positively and statistically significantly associated with organizational performance, and conditional slopes indicated that the strategy-performance association was positive where the policy environment was rated favourably and close to zero or slightly negative where it was rated unfavourably. Because the design was cross-sectional and every variable was reported by the same respondents on the same instrument, these results describe covariation among perception-based measures.
Interpretation: the regulatory environment appears to set the terms on which resource management pays off. Where rules on employment, procurement, reporting and data are clear, stable and mutually consistent, investments in staff, finance, facilities and digital systems can be converted into service delivery; where they are fragmented or unevenly enforced, the same investments are absorbed by compliance work, duplication and delay. This reading is consistent with Kenyan evidence that workforce efficiency depends on licensing arrangements, task allocation, payroll systems and county implementation capacity [3], with evidence from Uganda that moving HIV staff from donor contracts onto government payroll improved job security and retention where regulatory alignment was achieved [4], and with evidence that financial and physical resources contribute more effectively where procurement, accountability and governance systems are clear [8,9,22,23]. The descriptive results locate the difficulty more precisely. The policy and regulatory environment was the most uniformly rated construct in the instrument, with all ten item means falling within a fifth of a scale point, and its lowest-rated items concerned the internal embedding of contract terms and the timely communication of policy updates rather than formal alignment with external requirements. The difficulty managers describe is therefore one of operational translation rather than of policy absence.
Differences between resource domains: the product term was largest for human resource management and smallest for physical resource management, and the physical resource model accounted for markedly less variance (R2= 0.121) than the other three (0.298 to 0.375). The physical resource result is nonetheless distinctive: it is the only domain with no significant bivariate association with performance (r = 0.108, p = 0.070) and no significant coefficient in the main-effects model (b = 0.049, p = 0.30), yet its product term is significant. Workforce, financial, and digital decisions are the ones most directly governed by external rules; employment terms, payroll, licensing, cost allowability, procurement thresholds, reporting deadlines, and data standards, so managers may perceive the closest coupling between regulatory conditions and what those resources achieve. Physical infrastructure is largely fixed in the short term and reflects capital decisions taken years earlier, so current regulation has less scope to alter what it delivers; consistent with this, the physical composite was the lowest of the four.
Comparison and contrast with previous evidence: most studies of resource management and health system performance in Kenya and comparable settings relate measured resources to measured outputs, sometimes drawing on objective service indicators [3,9,22]. This study relates managers´ perceptions of resources to the same managers´ perceptions of performance, and that single difference accounts for both places where its findings sit awkwardly against the literature. Infrastructure investment has been shown to shape service delivery using measured infrastructure [22], so the weak physical resource model reported here may say more about how the construct was captured than about how much it matters. Regulation has been described as a determinant of donor-funded project sustainability in Kenya [7], and these findings are compatible with that account without being able to test it, since a cross-sectional survey cannot separate regulation shaping performance from well-performing programmes rating their regulation favourably. In neither case is agreement with prior work confirmation of it. This study contributes something narrower. It quantifies, across a single national sample of donor-funded HIV programmes, how closely resource management tracks performance at different points on managers' ratings of their regulatory environment.
Theoretical interpretation: the resource-based view holds that resources confer advantage when they are valuable, rare, difficult to imitate and supported by organizational systems able to exploit them [11,12,15]. The present findings bear on the fourth of these conditions rather than the first three, and they extend it outward: in donor-dependent public health programmes, the systems that determine whether a resource can be exploited are not wholly internal to the organization, since employment terms, procurement rules, reporting formats and data standards are set by donors and by national and county government. On this reading the policy and regulatory environment functions as a boundary condition on resource value, which is consistent with institutional accounts of how formal rules and enforcement determine whether investments become productive capabilities [15,16] and with the argument that the resource-based view requires adaptation before it is applied to public health management [17]. Dynamic capabilities theory [13,14] is also relevant, in that the capability implied by these results is the capacity to reconfigure staffing, financial processes and administrative systems as external requirements change. Two limits on this interpretation should be stated. The study measured perceptions of resources and of performance rather than the attributes the resource-based view specifies, so it does not establish that any resource here is valuable, rare or inimitable; and sustained advantage is defined over time, which a single cross-sectional survey cannot evaluate.
Strengths: the study covered senior managers in 40 of Kenya´s 47 counties and across public, faith-based and private-for-profit facilities, achieved a response rate of 70.5% with no missing item responses, measured four resource domains, the regulatory environment and performance with 110 purpose-written items whose internal consistency and unidimensional factor structure are reported, tested and reports the assumptions of its regression models, reports item-level descriptive statistics for every construct, and examines moderation across all four resource domains within a single national sample, which few studies in this setting have done.
Limitations: several limitations should be weighed. The design was cross-sectional and observational, so no temporal or causal inference is possible. Every construct, including the outcome, was self-reported by the same respondents on a single instrument, raising the possibility of common-method variance and social-desirability bias. Organizational performance was measured as managers´ perceptions rather than by objective indicators such as viral load suppression, retention in care, ART initiation, or reporting completeness. Internal consistency was computed on the pilot sample of 34 rather than the analytic sample, and the factor structure was examined by exploratory rather than confirmatory analysis. In the human resource management model, the Breusch-Pagan test indicated possible heteroscedasticity. The unit of analysis is the individual manager and not the programme, and respondents nested within programmes, organizations and counties were treated as independent observations, so standard errors may be underestimated. The models were unadjusted, no covariates being available, so confounding is not addressed. The product terms were formed from uncentred predictors, so the constituent coefficients are not interpretable at the values reported, and the change in R2attributable to each individual product term could not be computed. Seven counties were not represented, managers in Ministry of Health facilities predominated, and the achieved distribution by sampling stratum was not documented, so exact representativeness cannot be demonstrated. Finally, the coefficient for the product of the policy variable and information technology resource management was absent from the joint model output available, although the model´s degrees of freedom confirm that the term was fitted.
Implications for research: future studies should link resource management measures to routinely collected programme and financial indicators rather than to self-reported performance; obtain the explanatory, moderating and outcome measures from different sources or respondents, or separate them in time, to limit common-method variance; record programme, organization, facility and county identifiers so that the number of independent units is known and clustering can be modelled; mean-centre or standardize predictors before forming product terms and report the change in R2, simple slopes with confidence intervals and regression diagnostics; report reliability and factor structure for the measurement instrument; adjust for programme and organizational characteristics; and use longitudinal or quasi-experimental designs, including evaluation of specific regulatory harmonization measures introduced during donor transition, to examine whether changes in the policy environment are followed by changes in programme results.
Resource management strategies were associated with organizational performance in donor-funded HIV programmes in Kenya, and the strength of that association varied systematically with how senior managers rated the policy and regulatory environment. Where managers judged that environment favourable, workforce, financial and digital resource management accompanied substantially better-rated performance; where they judged it unfavourable, the same practices accompanied little or no advantage. Adding the four product terms to a model of main effects accounted for a further eleven percentage points of variance in performance, and the strongest conditional association was observed for human resource management. These findings position the regulatory environment as a condition under which resource investments are converted into service delivery rather than as a driver of performance in its own right, a reading consistent with its negligible independent contribution to the model. Managers rated the internal embedding of donor contract terms and the timely communication of policy updates least favourably of the regulatory items, which locates the practical difficulty in operational translation rather than in the absence of policy. Harmonising donor, national and county requirements into coherent and operationally embedded compliance systems therefore merits evaluation as a route to programme performance and sustainability, which longitudinal designs using independent performance indicators are now needed to test.
What is known about this topic
- Resource management strategies are associated with the performance of health programmes, but this association depends on the institutional and regulatory context;
- Donor-funded HIV programmes must comply with donor, national and county requirements at the same time.
What this study adds
- In Kenyan donor-funded HIV programmes, the association between resource management and self-reported performance was stronger where managers rated the policy and regulatory environment favourably, and close to zero where they rated it unfavourably;
- This pattern was observed for human resource, financial, physical and information technology resource management;
- The weakest-rated policy items were the embedding of donor contract terms in operating procedures and the timely communication of policy updates, pointing to harmonized compliance systems as a practical priority for evaluation.
The author declares no competing interests.
The author conceptualized the study, developed the study design, analyzed the data, interpreted the findings, and drafted the manuscript. The author have read and approved the final version of this manuscript.
The author thanks the respondents and institutional stakeholders who supported data collection and study implementation.
Table 1: summary of construct scores among senior managers of donor-funded HIV programmes in 40 donor-supported counties in Kenya, 2025 (n = 285)
Table 2: composite scores and highest- and lowest-rated items for human resource, financial, physical and information technology resource management strategies among senior managers of donor-funded HIV programmes in 40 donor-supported counties in Kenya, 2025 (n = 285)
Table 3:respondents´ perceptions of the policy and regulatory environment among senior managers of donor-funded HIV programmes in 40 donor-supported counties in Kenya, 2025 (n = 285)
Table 4: respondents´ ratings of organizational performance among senior managers of donor-funded HIV programmes in 40 donor-supported counties in Kenya, 2025 (n = 285)
Table 5:internal consistency and construct validity of the six study scales among senior managers of donor-funded HIV programmes in Kenya, 2025 (pilot n = 34; analytic n = 285)
Table 6: pearson correlation and unadjusted simple linear regression of organizational performance on each resource management strategy among donor-funded HIV programmes in Kenya, 2025 (n = 285)
Table 7: moderated regression models of organizational performance on each resource management strategy and the policy and regulatory environment among donor-funded HIV programmes in Kenya, 2025 (n = 285)
- World Health Organization. Working for health 2022-2030 action plan. WHO. 2022 Nov 30. Google Scholar
- World Health Organization. Tracking universal health coverage: 2023 global monitoring report. WHO. 2021 Dec 12. Google Scholar
- Nyawira L, Tsofa B, Musiega A, Munywoki J, Njuguna RG, Hanson K et al. Management of human resources for health: implications for health systems efficiency in Kenya. BMC Health Serv Res. 2022 Aug 16;22(1):1046. PubMed | Google Scholar
- Zakumumpa H, Rujumba J, Amde W, Damian RS, Maniple E, Ssengooba F. Transitioning health workers from PEPFAR contracts to the Uganda government payroll. Health Policy Plan. 2021 Oct 12;36(9):1397-1407. PubMed | Google Scholar
- McIsaac M, Buchan J, Abu-Agla A, Kawar R, Campbell J. Global strategy on human resources for health: workforce 2030-a five-year check-in. Hum Resour Health. 2024 Oct 3;22(1):68. PubMed | Google Scholar
- Leslie K, Bourgeault IL, Carlton AL, Balasubramanian M, Mirshahi R, Short S et al. Design, operation and strengthening of health practitioner regulation systems: A rapid integrative review. Hum Resour Health. 2023 Sep 4;21(1):72. PubMed | Google Scholar
- Micheni AK, Were S, Namusonge G. Influence of the Moderating Role of Legal & Regulatory Framework on Project Governance and Sustainability of Donor-Funded Projects in the Health Sector in Kenya. IJSSME. 2025 Feb 21;9(1). Google Scholar
- Njagi E, Muathe S, Muchemi A. Financial resources, physical resources and performance of public health institutions in Embu County, Kenya. Academia. Edu. 2018. Google Scholar
- Shigali SM, Shitseswa AE. Effect of Physical Resource Allocation Strategies on Public Service Delivery: A Case of Vihiga County Government, Kenya. African Journal of Empirical Research. 2023 Sep 14;4(1):256-64. Google Scholar
- Jousset O, Kimeu M, Müller T, Sforza G, Sun YS, Ustun A, Wilson M. How digital tools could boost efficiency in African health systems. McKinsey and Company, March. 2023.
- Barney J. Firm resources and sustained competitive advantage. J Manag. 1991 Mar;17(1):99-120. Google Scholar
- Hitt MA, Hoskinsson RE, Ireland DR. Strategic management: concepts and cases competitiveness and Globalisation. Thomson Learning. 2007.
- Teece DJ, Pisano G, Shuen A. Dynamic capabilities and strategic management. Strategic management journal. 1997 Aug;18(7):509-33. Google Scholar
- Teece DJ. The foundations of enterprise performance: Dynamic and ordinary capabilities in an (economic) theory of firms. Academy of management perspectives. 2014 Nov;28(4):328-52. Google Scholar
- Newbert SL. Empirical research on the resource-based view of the firm: an assessment and suggestions for future research. Strategic management journal. 2007 Feb;28(2):121-46. Google Scholar
- Scott WR. Institutions and organizations: Ideas, interests, and identities. Sage publications; 2013 Jul 24. Google Scholar
- Kosiol J, Fraser L, Fitzgerald A, Radford K. Resource-based view: A new strategic perspective for public health service managers. Asia Pacific Journal of Health Management. 2023 Mar;18(1):8-19. Google Scholar
- Kash BA, Spaulding A, Johnson CE, Gamm L. Success factors for strategic change initiatives: A qualitative study of healthcare administrators' perspectives. J Healthc Manag. 2014 Jan-Feb;59(1):65-81. PubMed | Google Scholar
- Ambrosini V, Bowman C, Collier N. Dynamic capabilities: An exploration of how firms renew their resource base. BJM. 2009 Mar;20:S9-24. Google Scholar
- Kero CA, Bogale AT. A Systematic Review of Resource-Based View and Dynamic Capabilities of Firms and Future Research Avenues. IJSDP. 2023 Oct 1;18(10). Google Scholar
- Qin X, Huang YN, Hu Z, Chen K, Li L, Wang RS et al. Human resource management research in healthcare: a big data bibliometric study. Hum Resour Health . 2023 Dec 5;21(1):94. PubMed | Google Scholar
- Foster V, Gorgulu N, Straub S, Vagliasindi M. The impact of infrastructure on development outcomes. Washington, DC: World Bank; 2023 Mar. Google Scholar
- Stoumpos AI, Kitsios F, Talias MA. Digital transformation in healthcare: technology acceptance and its applications. Int J Environ Res Public Health. 2023 Feb 15;20(4):3407. PubMed | Google Scholar
- Nguyen NT. Intellectual capital and financial performance of industrial firms in emerging countries: Empirical evidence from Vietnam. GBFR 2023;28(2):107-22. Google Scholar
- von Elm E, Altman DG, Egger M, Pocock SJ, Gotzsche PC, Vandenbroucke JP. The Strengthening the Reporting of Observational Studies in Epidemiology (STROBE) statement: guidelines for reporting observational studies. Lancet. 2007 Oct 20;370(9596):1453-7. PubMed | Google Scholar
- Yamane T. Statistics: An Introductory Analysis. New York. Harper and Row. 1967. Google Scholar
- Aiken LS, West SG. Multiple regression: testing and interpreting interactions. Newbury Park (CA): SAGE Publications; 1991. Google Scholar
- Dawson JF. Moderation in management research: what, why, when, and how. J Bus Psychol. 2014 Mar;29(1):1-9. Google Scholar
- Podsakoff PM, MacKenzie SB, Podsakoff NP. Sources of method bias in social science research and recommendations on how to control it. Annu Rev Psychol. 2012;63:539-69. PubMed | Google Scholar
Search
This article authors
On Pubmed
On Google Scholar
Citation [Download]
Navigate this article
Similar articles in
Key words
Tables and figures

Article metrics
Recently from the PAMJ






Authors´ services