
Trends in severe and moderate child food poverty among children aged 6-23 months in Ghana, 2008-2022
Abdul-Wahab Inusah, Moses Nwuzoh, Victor Mogre, Shamsu-Deen Ziblim
Corresponding author: Abdul-Wahab Inusah, Department of Global and International Health, School of Public Health, University for Development Studies, Tamale, Ghana 
Received: 15 Mar 2026 - Accepted: 06 May 2026 - Published: 29 Jun 2026
Domain: Population Health,Child nutrition,Malnutrition
Keywords: Child food poverty, dietary diversity, Ghana, complementary feeding, socioeconomic inequalities
Funding: This work received no specific grant from any funding agency in the public, commercial, or non-profit sectors.
©Abdul-Wahab Inusah et al. Pan African Medical Journal (ISSN: 1937-8688). This is an Open Access article distributed under the terms of the Creative Commons Attribution International 4.0 License (https://creativecommons.org/licenses/by/4.0/), which permits unrestricted use, distribution, and reproduction in any medium, provided the original work is properly cited.
Cite this article: Abdul-Wahab Inusah et al. Trends in severe and moderate child food poverty among children aged 6-23 months in Ghana, 2008-2022. Pan African Medical Journal. 2026;54:62. [doi: 10.11604/pamj.2026.54.62.52162]
Available online at: https://www.panafrican-med-journal.com//content/article/54/62/full
Research 

Trends in severe and moderate child food poverty among children aged 6-23 months in Ghana, 2008-2022
Trends in severe and moderate child food poverty among children aged 6-23 months in Ghana, 2008-2022
![]() Abdul-Wahab Inusah1,&,
Abdul-Wahab Inusah1,&, ![]() Moses Nwuzoh2,3, Victor Mogre4,
Moses Nwuzoh2,3, Victor Mogre4, ![]() Shamsu-Deen Ziblim5
Shamsu-Deen Ziblim5
&Corresponding author
Introduction: child food poverty reflects poor dietary diversity during early childhood and poses serious risks to growth, development, and survival. In Ghana, evidence on long-term trends, severity, and inequalities remains limited.
Methods: we analyzed secondary data from five nationally representative surveys conducted between 2008 and 2022, including Demographic and Health Surveys (2008, 2014, 2022) and Multiple Indicator Cluster Surveys (2011, 2017). Severe and moderate child food poverty were defined using UNICEF criteria based on consumption of 0-2 and 3-4 food groups, respectively, in the previous 24 hours. Survey weights and complex design were applied, with disaggregation by child age, sex, residence, maternal education, and household wealth.
Results: severe child food poverty increased from 38.0% (95% CI: 33.6-42.5) in 2008 to 45.7% (95% CI: 41.8-49.7) in 2014, before declining to 37.2% (95% CI: 33.4-41.2) in 2022. Moderate food poverty remained persistently high (49.0% in 2008; 46.7% in 2022). Substantial regional disparities were evident between 2008 and 2017, with higher severe food poverty in northern and selected middle belt regions, including Northern, Upper West, and Volta, and lower prevalence in Greater Accra. Rural children consistently experienced a higher prevalence than urban children (36.3% vs 25.1% in 2017; 23.7% vs 18.7% in 2022). Severe deprivation was highest among children aged 6-11 months (48.5% in 2014), while moderate deprivation peaked among those aged 20-23 months (55.8% in 2011; 46.7% in 2022). In 2022, severe food poverty was higher among the poorest households (27.5% vs 17.8%) and children of mothers with no education (27.6% vs 16.8%).
Conclusion: child food poverty in Ghana remains widespread, with persistent socioeconomic and geographic inequalities. Differentiating severe from moderate deprivation strengthens the evidence base for equity-focused nutrition policies.

Child food poverty refers to deprivation in the quality of diets consumed by children aged 6-23 months within the previous 24 hours, reflecting limited access to nutritionally adequate and diverse foods during a critical developmental period [1]. United Nations Children´s Fund (UNICEF) estimates that approximately one quarter of children globally live in food poverty, largely driven by poor diet quality, which substantially increases the risk of severe malnutrition, morbidity, and mortality [1]. Child food poverty, therefore, represents a major public health concern, as diet quality in the first two years of life is widely recognised as a fundamental determinant of child survival, growth, neurodevelopment, and lifelong health and wellbeing.
The first two years of life coincide with the “first 1,000 days”, a window characterised by rapid brain growth and organ development, during which infants are particularly sensitive to nutrient deficiencies and dietary excesses [2]. From around 6-23 months of age, breastmilk alone is no longer sufficient to meet children´s evolving nutritional requirements. Consequently, the World Health Organization (WHO) and UNICEF recommend that children aged 6-23 months receive safe, frequent, and nutrient-dense complementary foods alongside continued breastfeeding to meet energy and micronutrient needs essential for optimal development [3]. Despite these recommendations, global adherence to appropriate complementary feeding practices remains low, with fewer than one quarter of children aged 6-23 months worldwide meeting age-appropriate dietary diversity and feeding frequency standards [3].
Globally, child food poverty is driven by structural inequalities that shape food systems, caregiving environments, and household resources. Climate change, conflict, and economic instability increasingly disrupt food availability, affordability, and access, particularly in low- and middle-income countries [1]. Of the estimated 181 million children living in severe child food poverty worldwide, approximately 121 million reside in low- and middle-income countries [1]. West and Central Africa bear a particularly high burden, with recent estimates indicating severe child food poverty prevalence between 32% and 42%, although substantial variation exists across countries [1]. Across sub-Saharan Africa, evidence shows that over 80% of children aged 6-23 months fail to achieve minimum dietary diversity and commonly consume unhealthy foods, including sugar-sweetened beverages and sentinel foods, with marked disparities by age, household wealth, maternal antenatal care attendance, and place of residence [4].
Sub-Saharan country-level studies further illustrate the severity and heterogeneity of child food poverty across the region. In conflict-affected Somalia, an estimated 63% of children experience severe child food poverty, with over 80% of children in vulnerable communities reportedly skipping meals entirely [5]. In food-insecure rural areas of Ethiopia, high levels of undernutrition persist among children aged 6-23 months, including 42.7% stunting, 9.9% wasting, and 27.7% underweight [6]. Although some countries in West and Central Africa have recorded improvements, including a regional decline in severe child food poverty from 42% to 32% and substantial reductions in Burkina Faso between 2010 and 2021 [5], progress remains uneven and fragile. Since 2019, economic shocks, conflict, and climate-related events have stalled or reversed gains in many sub-Saharan African countries [5,7].
In Ghana, a low-income country in sub-Saharan Africa, about 2.4 million children under five are living in child food poverty [8]. Furthermore, approximately 62% of children aged 6-23 months exhibit unhealthy feeding practices, characterised by low dietary diversity and high consumption of sugary foods with limited fruit and vegetable intake [4]. Malnutrition risks are regionally patterned, with northern regions consistently reporting higher clustering of adverse nutrition outcomes such as stunting (18-19%), wasting (6-7%) and underweight (11-12%), while transitions to eastern zones have been associated with lower stunting odds [9,10]. However, post-2020 economic shocks, including rising inflation [11], have slowed national progress and require further investigation. Key drivers of child food poverty in Ghana include maternal education gaps, rural residence, household wealth inequalities, and food system vulnerabilities, alongside other sociodemographic constraints that limit attainment of minimum acceptable diets among children aged 6-23 months [11,12].
Although Ghana demographic and health survey (DHS) and multiple indicator cluster survey (MICS) data routinely report infant and young child feeding indicators, enabling national monitoring [13,14], important evidence gaps persist. Much of the existing literature relies on single survey waves or focuses on minimum dietary diversity and minimum acceptable diet without assessing whether progress is sustained across periods of economic and food system disruption [4,15,16]. Studies rarely distinguish between severe and moderate child food poverty, despite the likelihood that the determinants and policy responses required to address extreme dietary deprivation differ from those needed to transition children from moderate deprivation to adequate diets [17,18]. Subnational analyses are often limited to single time points, offering limited insight into how geographic inequalities evolve over time using harmonised definitions [4,16,18]. Furthermore, while wealth, maternal education, residence and child age are recognised correlates of feeding practices, only few studies quantify how these gradients change across multiple nationally representative surveys using comparable measures and uncertainty estimates [4,15,19], meaning that they cannot be used to quantify how inequality gradients change over time.
In response to some of these gaps, this study examines trends in severe and moderate child food poverty among children aged 6-23 months in Ghana from 2008 to 2022, using five nationally representative DHS and MICS surveys. The study quantifies national trends, assesses inequalities across key sociodemographic dimensions, and describes subnational patterns where regional estimates are available. Although the analysis is descriptive and does not seek to identify causal drivers of child food poverty, by disaggregating severe and moderate child food poverty across time, this analysis aims to provide an equity-focused assessment of early childhood dietary deprivation aligned with WHO-UNICEF measurement standards, with direct relevance for nutrition and social protection prioritisation in Ghana.

Study design: this study is a secondary analysis of nationally representative cross-sectional survey data from Ghana, examining trends in severe and moderate child food poverty among children aged 6-23 months between 2008 and 2022.
Setting: data were obtained from the UNICEF global database on infant and young child feeding (IYCF), which compiles harmonized indicators derived from demographic and health surveys (DHS) and multiple indicator cluster surveys (MICS) [20]. The analysis included five surveys conducted in Ghana: DHS 2008, DHS 2014, DHS 2022, MICS 2011, and MICS 2017 [13,21-26].
The DHS and MICS are nationally representative household surveys implemented by national statistical authorities using standardized survey instruments and protocols to ensure comparability across countries and over time [13,18,23-26]. In Ghana, all survey rounds used multistage, stratified cluster sampling designs based on the most recent national population census available at the time of data collection. In the first stage, census enumeration areas were selected within strata defined by administrative region and urban-rural residence using probability proportional to size. In the second stage, households were systematically selected from each sampled enumeration area. All women aged 15-49 years residing in selected households were eligible for interview, and information on infant and young child feeding practices was collected for children aged 6-23 months living with them [13,16,23-26].
Participants: the study population comprised children aged 6-23 months with available 24-hour dietary recall information in each survey round. For each survey, the denominator included all eligible children with complete feeding information [13,16,23-26]. Children with missing data on food group consumption were excluded from the calculation of child food poverty indicators. All included participants were drawn from nationally representative samples using DHS and MICS sampling procedures [13,23-26].
Variables: the dependent variables in this study were severe child food poverty and moderate child food poverty, defined using UNICEF standardized dietary diversity thresholds [1,21,22]. Dietary diversity was assessed based on the number of food groups consumed by children aged 6-23 months in the 24 hours preceding the survey. Severe child food poverty was defined as consumption of foods from 0-2 of the eight standard food groups, while moderate child food poverty was defined as consumption from 3-4 food groups [1,21,22]. Dietary diversity scores were derived from eight standard food groups: breastmilk; grains, roots, and tubers; legumes and nuts; dairy products; flesh foods (meat, fish, poultry, and organ meats); eggs; vitamin A-rich fruits and vegetables; and other fruits and vegetables [27,28].
The independent variables (covariates/equity stratifiers) included child sex (male, female), place of residence (urban, rural), household socioeconomic status measured using the DHS/MICS wealth index (quintiles 1-5), maternal education (no education, primary, secondary, higher), child age categories (6-11, 12-15, 16-19, and 20-23 months), and administrative region of residence where available [19,23-26,28]. These variables were selected to assess disparities in child food poverty across key demographic, socioeconomic, and geographic subgroups.
Data sources/measurement: infant and young child feeding practices were assessed using 24-hour dietary recall questions administered to the child´s primary caregiver, usually the mother [28]. Caregivers reported whether the child consumed specific food items during the day or night preceding the survey interview, recorded as binary indicators (yes/no). Food items were classified into eight standardized food groups defined by UNICEF: (1) breastmilk; (2) grains, roots, and tubers; (3) legumes and nuts; (4) dairy products; (5) flesh foods; (6) eggs; (7) vitamin A-rich fruits and vegetables; and (8) other fruits and vegetables [27,28].
Consumption of each food group was coded as 1 if consumed in the previous 24 hours and 0 otherwise. A dietary diversity score ranging from 0 to 8 was generated by summing the food groups consumed [28].
Sample size determination: sample size was determined by the DHS and MICS survey designs. The analytic sample varied across survey rounds depending on the number of children aged 6-23 months with complete dietary recall information [13,23-26]. No additional sample size calculation was performed, as this study relied on existing nationally representative datasets [29].
Statistical methods and bias: for each survey round, nationally representative estimates were generated by applying sampling weights to account for unequal probabilities of selection, non-response, and differential population coverage. These estimates incorporated the complex survey design of the DHS and MICS, including clustering at the enumeration area level and stratification by region and place of residence, in line with established methodological guidance [29,30]. Weighted point estimates of the proportion of children classified as moderately or severely food poor were calculated, alongside corresponding 95% confidence intervals derived using design-based variance estimation methods appropriate for complex survey data. Estimates based on small, unweighted sample sizes were handled in accordance with UNICEF guidance and, where applicable, interpreted with caution due to reduced statistical precision [29-32].
Missing data were handled by restricting analyses to children with complete dietary recall information, consistent with DHS and MICS analytical approaches [29,30]. No additional sample size calculation was performed, as this study relied on existing nationally representative datasets [29]. Potential sources of bias include recall bias from caregiver-reported dietary intake and exclusion of children with incomplete feeding data [29].
Ethical considerations: this study used publicly available, de-identified secondary data and involved no direct contact with human participants. Ethical approval and informed consent were obtained by the original survey implementers. The present analysis complied with UNICEF data access, use, and reporting policies.
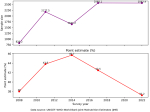
Participants: the analysis included children aged 6-23 months from five nationally representative surveys conducted in Ghana between 2008 and 2022. UNICEF-harmonized estimates were derived from children with available 24-hour dietary recall information, which allowed classification of moderate and severe child food poverty. Sample sizes ranged from 826 to 2,565 children per survey (Figure 1). All analyses were restricted to children with complete feeding data; children with missing dietary information were excluded.
National level trends in child food poverty in Ghana, 2008-2022: severe child food poverty increased from 38.0% in 2008 to 43.8% in 2011, reaching a peak of 45.7% in 2014, before declining to 42.5% in 2017 and 37.2% in 2022. These findings suggest that child food poverty in Ghana rose during the early 2010s and has begun to decrease in recent years (Figure 1).
Regional patterns comparing severe and moderate child food poverty: regional differences were observed for both severe and moderate child food poverty, with moderate food poverty consistently exceeding severe food poverty across all regions and survey years for which regional estimates were available.
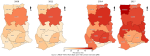
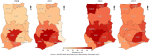
In 2008, this contrast was pronounced across regions. For example, Ashanti recorded 17.5% severe food poverty compared with 49.0% moderate food poverty, while Greater Accra recorded 16.2% severe versus 28.4% moderate food poverty. The Northern Region reported relatively high severe food poverty (31.3%) alongside a moderate prevalence of 32.8%, indicating a narrower gap between severity levels compared with other regions. In 2011, severe food poverty remained comparatively high in the Northern Region (36.8%), while moderate food poverty was 35.2%, again showing close alignment between the two indicators. In contrast, several regions exhibited wide severe-moderate gaps, including Ashanti (15.1% severe vs 51.3% moderate) and Western (22.5% severe vs 49.5% moderate). By 2014, severe food poverty increased in several regions while moderate food poverty remained high. For example, the Eastern Region recorded 38.6% severe and 47.4% moderate food poverty, while Upper West reported 29.1% severe compared with 52.3% moderate food poverty. In Ashanti, both indicators were elevated (38.1% severe; 51.4% moderate), indicating concurrent increases in severity and moderate deprivation.
In 2017, regional contrasts persisted, with some regions experiencing particularly high severe prevalence alongside high moderate prevalence. Upper West recorded the highest severe food poverty (45.1%) with moderate food poverty of 41.2%. Volta Region showed similarly elevated levels (39.9% severe; 45.6% moderate), while Brong Ahafo recorded 39.7% severe and 41.7% moderate. Across the study period, Greater Accra generally reported lower severe food poverty compared with most regions (for example, 12.4% in 2011 and 14.5% in 2014), although moderate food poverty remained substantial (for example, 49.2% in 2011).
Overall, moderate child food poverty remained consistently high across regions, while severe child food poverty showed greater temporal fluctuation. Regional estimates for 2022 were not available and are therefore not presented in Figure 2 and Figure 3.
Prevalence of severe and moderate child food poverty among children aged 6-23 months in Ghana, by selected sociodemographic characteristics and survey year (2008-2022): across five nationally representative surveys between 2008 and 2022, severe child food poverty among children aged 6-23 months in Ghana increased from 2008 to 2017 before declining in 2022, while moderate child food poverty remained consistently high across all survey years. Sex differences in severe and moderate child food poverty were relatively small across survey waves. Among male children, severe food poverty increased from 17.5% (95% CI: 13.7-22.1) in 2008 to 32.6% (95% CI: 28.9-36.5) in 2017, before declining to 22.4% (95% CI: 19.6-25.5) in 2022. Similar trends were observed among female children, with overlapping confidence intervals across survey years.
Clear disparities were evident by place of residence. Rural children consistently experienced a higher prevalence of severe and moderate child food poverty compared with urban children. In 2017, severe child food poverty among rural children was 36.3% (95% CI: 33.0-39.7) compared with 25.1% (95% CI: 21.4-29.2) among urban children. Although prevalence declined in 2022, rural-urban differences persisted for both severe (23.7% vs 18.7%) and moderate (38.8% vs 35.4%) child food poverty. Strong age-related gradients were also observed. Severe child food poverty was highest among children aged 6-11 months, peaking at 48.5% (95% CI: 42.4-54.7) in 2014, and declined with increasing age. In contrast, moderate child food poverty increased with age and was highest among children aged 20-23 months, reaching 55.8% (95% CI: 48.5-62.9) in 2011 and remaining high in 2022 (46.7%; 95% CI: 40.4-53.1).
Socioeconomic gradients were evident, particularly for severe child food poverty. Children in poorer wealth quintiles experienced higher prevalence compared with those in the richest quintile, especially in 2014 and 2017. In 2022, severe child food poverty was 27.5% (95% CI: 23.4-32.2) among children in the poorest households compared with 17.8% (95% CI: 13.1-23.7) among those in the richest households. Moderate child food poverty was observed across all wealth groups but remained lowest among children in the richest households (25.5%; 95% CI: 19.0-33.3 in 2022).
Differences were also observed by maternal education. Across survey years, children born to mothers with no or primary education consistently experienced a higher prevalence of severe and moderate child food poverty compared with children whose mothers had secondary or higher education. In 2022, severe child food poverty among children of mothers with no education was 27.6% (95% CI: 23.6-32.1) compared with 16.8% (95% CI: 11.4-24.0) among children whose mothers had higher education, although estimates for higher education were less precise in some survey years due to smaller sample sizes (Table 1).
This study provides nationally comparable estimates of severe and moderate child food poverty among Ghanaian children aged 6-23 months from 2008 to 2022 using UNICEF-harmonized IYCF indicators. Overall, child food poverty remained high across the period, rising from 38.0% in 2008 to 45.7% in 2014 before declining to 37.2% in 2022. This non-linear pattern suggests that improvements in young children´s diets are not sustained automatically and remain vulnerable to fluctuations in household purchasing power, food prices, and food system availability, particularly for nutrient-dense foods that underpin dietary diversity [33-35]. Although prevalence in 2022 returned close to 2008 levels, the persistence of substantial severe and moderate deprivation indicates that many children continue to consume nutritionally narrow diets, with ongoing implications for micronutrient deficiencies and growth faltering.
Comparisons with Ghana studies using WHO-UNICEF complementary feeding indicators reinforce the conclusion that diet quality deprivation is widespread [17,36], although direct numerical equivalence is limited by differences in indicator definitions. Using the 2022 Ghana DHS, Tekeba et al. reported that 39.1% of children met minimum dietary diversity and 23.5% met the minimum acceptable diet, indicating that most children still fall short of recommended standards [36]. These findings correspond with the high burden of child food poverty observed in this study, as both approaches are anchored in dietary diversity. However, a minimum acceptable diet is more precise as it incorporates feeding frequency and breastfeeding conditions [28], which explains its consistently lower prevalence and limits its use as a direct proxy for severe or moderate food poverty. Similarly, Akanbonga et al. analyzing Ghana MICS 2017-2018, reported low prevalence of minimum dietary diversity (25.4%) and minimum acceptable diet (11.7%) [9], but these estimates are not fully comparable with more recent harmonized reporting, because the WHO-UNICEF complementary feeding indicator definitions have been updated over time [28]. In earlier guidance (WHO 2008), minimum dietary diversity (MDD) was defined as consuming at least 4 out of 7 food groups, and breastmilk was not counted as a food group, which can systematically affect MDD classification, particularly for breastfed children [18,37]. By contrast, updated WHO-UNICEF guidance redefined MDD as consuming at least 5 out of 8 food groups, explicitly including breastmilk as one of the food groups, thereby changing both the food-group structure and the threshold used to define adequate diversity [28]. Akanbonga et al. estimates therefore reinforce the conclusion that diet quality deprivation is widespread in Ghana but should be interpreted as conceptually comparable rather than numerically equivalent to estimates generated under updated harmonized definitions [9,18,28].
Marked subnational heterogeneity was evident. Moderate food poverty exceeded severe food poverty across all regions, but severe food poverty fluctuated more sharply. The Northern Region showed relatively high severe prevalence with a narrow severity gap (31.3% severe vs 32.8% moderate in 2008; 36.8% vs 35.2% in 2011), suggesting clustering near extreme dietary exclusion. In 2014, several regions experienced concurrent increases, including Eastern (38.6% severe; 47.4% moderate) and Ashanti (38.1% severe; 51.4% moderate). By 2017, very high severe prevalence was observed in Upper West (45.1%) and Volta (39.9%). These patterns are consistent with Ghana evidence linking complementary feeding to place-based food environments and structural constraints [15,38-40], and highlight the limitations of national averages in capturing subnational vulnerability. The absence of regional estimates for 2022 restricts the assessment of whether national improvement reflected a broad-based recovery or region-specific change.
Persistent inequalities by residence, wealth, and maternal education further underscore the structural nature of child food poverty. In 2017, severe food poverty affected 36.3% of rural children compared with 25.1% of urban children, with moderate food poverty also higher in rural areas. Although prevalence declined by 2022, rural disadvantage persisted (23.7% vs 18.7% severe; 38.8% vs 35.4% moderate). This aligns with Ghana studies showing lower minimum dietary diversity and acceptable diet among rural households and supports evidence that dietary deprivation reflects affordability, market access, and livelihood constraints rather than individual behaviour alone [9,36,41]. Wealth gradients were most pronounced for severe food poverty as reported by similar studies [16,42], indicating heightened sensitivity of extreme deprivation to purchasing power and the affordability of animal-source foods, fruits, and vegetables. Maternal education gradients were similarly consistent, mirroring prior Ghana evidence [36].
Age-related patterns provide further insight. Severe food poverty was highest among children aged 6-11 months, while moderate food poverty increased with age and peaked among children aged 20-23 months. This divergence is biologically and behaviorally plausible and consistent with earlier Ghana evidence showing strong age patterning in dietary diversity [41]. Early complementary feeding often involves a narrow range of foods, increasing the risk of severe deprivation, whereas older children may consume more food groups yet still fail to achieve adequacy.
Placed in the wider sub-Saharan African context, Ghana´s patterns are consistent with regional evidence. A multi-country analysis across 80 low- and middle-income countries found that only around one in four children had sufficiently diverse diets and documented substantial socioeconomic inequalities [43]. The UNICEF child food poverty report further emphasizes that severe food poverty reflects extreme dietary deprivation sustained by failures across food, health, and social protection systems [44], underscoring the need for differentiated policy responses for severe versus moderate deprivation.
Strengths and limitations: this study has several important strengths. It draws on multiple nationally representative DHS and MICS surveys spanning more than a decade, allowing a rare long-term assessment of child food poverty in Ghana across periods of economic and food system change. The use of a severity-sensitive classification aligned with UNICEF definitions extends beyond conventional complementary feeding indicators and enables a clearer distinction between severe and moderate dietary deprivation. Systematic disaggregation across key equity stratifiers, including child age, sex, place of residence, maternal education, household wealth, and region where available, provides an explicit equity-focused assessment and highlights populations consistently left behind by aggregate trends. Although this study relied on UNICEF harmonized estimates rather than survey microdata, which precluded multivariable modelling and decomposition, this approach supports consistent comparability over time using standardized definitions and processing. The analysis, therefore, provides policy-relevant surveillance of levels, trends, and equity gaps in child food poverty, helping to guide targeting and prioritize subsequent microdata-based causal work.
This study shows that severe and moderate child food poverty among children aged 6-23 months in Ghana remained high between 2008 and 2022, with non-linear national trends and persistent inequalities by residence, wealth, maternal education, and child age. Although national prevalence declined by 2022, substantial proportions of children continued to experience dietary deprivation, particularly in rural and socioeconomically disadvantaged households. Clear age gradients indicate heightened vulnerability to severe food poverty in early complementary feeding and sustained moderate deprivation among older toddlers. By applying a severity-sensitive classification across multiple nationally representative surveys, this study extends existing evidence beyond conventional feeding indicators and highlights populations consistently left behind. These findings emphasize the need for nutrition and social protection policies that address both extreme and moderate dietary deprivation and that prioritize equity in early childhood diet quality.
What is known about this topic
- Child food poverty reflects poor dietary diversity among children aged 6-23 months and is associated with increased risk of malnutrition and poor development;
- Previous studies in Ghana have reported low levels of minimum dietary diversity and minimum acceptable diet among young children;
- Socioeconomic factors such as household wealth, maternal education, and rural residence influence complementary feeding practices.
What this study adds
- This study provides the first long-term analysis of severe and moderate child food poverty trends in Ghana from 2008-2022 using harmonized DHS and MICS estimates;
- It distinguishes between severe and moderate deprivation, offering clearer insights for policy prioritization;
- The findings reveal persistent socioeconomic and geographic inequalities, highlighting populations most affected by dietary deprivation.
The authors declare no competing interests.
Abdul-Wahab Inusah led the study, conceptualized it, and coordinated the field investigation; Moses Nwuzoh, Victor Mogre, and Shamsu-Deen Ziblim contributed to the study´s conceptualization, design, and data collection; Abdul-Wahab Inusah, Victor Mogre, and Shamsu-Deen Ziblim conducted data analysis and interpretation; Victor Mogre provided technical guidance, academic supervision, and critical review of the manuscript; Abdul-Wahab Inusah and Moses Nwuzoh drafted the initial manuscript, while Victor Mogre and Shamsu-Deen Ziblim provided substantive revisions and editorial inputs. All the authors read and approved the final version of this manuscript.
The authors wish to acknowledge UNICEF for providing access to the global database on infant and young child feeding (IYCF) and for harmonizing the survey data used in this analysis. We also thank the Ghana Statistical Service and USAID-DHS Program for generating and making the DHS and MICS data publicly available.
Table 1: prevalence of severe and moderate child food poverty among children aged 6-23 months in Ghana, by selected socio-demographic characteristics and survey year (2008-2022)
Figure 1: national trends in severe child food poverty among children aged 6-23 months in Ghana, 2008-2022
Figure 2: subnational patterns of severe child food poverty among children aged 6-23 months in Ghana, 2008-2017 (UNICEF harmonized demographic and health surveys (2008, 2014) and multiple indicator cluster surveys (2011, 2017))
Figure 3: subnational patterns of moderate child food poverty among children aged 6-23 months in Ghana, 2008-2017 (UNICEF harmonized demographic and health surveys (2008, 2014) and multiple indicator cluster surveys (2011, 2017))
- United Nations Children's Fund (UNICEF). UNICEF: 1 in 4 children globally live in severe child food poverty. 2024. Accessed 28th December, 2025.
- United Nations Children's Fund (UNICEF) Lao People's Democratic Republic. Ensuring a Healthy Start: The First 1,000 Days. Accessed 3rd January, 2026.
- World Health Organization, United Nations Children´s Fund. Infant and young child feeding. 2023. Accessed 26th January, 2026.
- Tekeba B, Tamir TT, Workneh BS, Wassie M, Terefe B, Ali MS et al. Prevalence and determinants of unhealthy feeding practices among young children aged 6-23 months in five sub-Saharan African countries. PLoS One. 2025 Jan 15;20(1):e0317494. PubMed | Google Scholar
- United Nations Children's Fund (UNICEF) USA. UNICEF Report: Child Food Poverty. UNICEF Report: Child Food Poverty. UNICEF USA. Accessed 10th January, 2026.
- Tafese Z, Reta F, Mulugeta B, Anato A. Child undernutrition and associated factors among children 6-23 months old in largely food insecure areas of rural Ethiopia. J Nutr Sci. 2022 Aug 3;11:e63. PubMed | Google Scholar
- Kohnert D. Poverty, Food Insecurity and Malnutrition in Sub-Saharan Africa. 2025. Accessed 11th January, 2026.
- United Nations Children's Fund (UNICEF) Ghana. What is Child Food Poverty? Everything You Need to Know About the Crisis in Ghana. 2025. Accessed 15th January, 2026.
- Akanbonga S, Hasan T, Chowdhury U, Kaiser A, Akter Bonny F, Lim IE et al. Infant and young child feeding practices and associated socioeconomic and demographic factors among children aged 6-23 months in Ghana: Findings from Ghana Multiple Indicator Cluster Survey, 2017-2018. PLoS One. 2023 Jun 9;18(6):e0286055. PubMed | Google Scholar
- Osborne A, Bangura C, Sesay U, Ahinkorah BO. Trends and inequalities in stunting and underweight among children aged 0-59 months in Ghana, 1993-2022. Int J Equity Health. 2025 Jun 10;24(1):168. PubMed | Google Scholar
- Budu E, Armah-Ansah EK, Gyawu NO, Tweneboah R, Sekyi-Dickson K, Oga-Omenka C et al. Factors associated with inequalities in malnutrition among children in Ghana using the 2022 GDHS and WHO HEAT framework. BMC Public Health. 2025 Aug 27;25(1):2954. PubMed | Google Scholar
- Inclusion Ghana. Social Protection Budget Brief. 2021. Accessed 17th January, 2026.
- Ghana Statistical Service, ICF. Ghana Demographic and Health Survey 2022. 2024. Accessed 20th January, 2026.
- United Nations Children's Fund (UNICEF) Ghana. Ghana Multiple Cluster Indicator Survey Findings Report. Accessed 20th January, 2026.
- Issaka AI, Agho KE, Burns P, Page A, Dibley MJ. Determinants of inadequate complementary feeding practices among children aged 6-23 months in Ghana. Public Health Nutr. 2015 Mar;18(4):669-78. PubMed | Google Scholar
- Anane I, Nie F, Huang J. Socioeconomic and Geographic Pattern of Food Consumption and Dietary Diversity among Children Aged 6-23 Months Old in Ghana. Nutrients. 2021 Feb 12;13(2):603. PubMed | Google Scholar
- Atosona A, Mohammed JA, Issahaku H, Saani K, Addae HY, Azupogo F. Maternal employment status and child age are positive determinants of minimum dietary diversity among children aged 6-23 months in Sagnarigu municipality, Ghana: a cross-sectional study. BMC Nutr. 2024 Apr 15;10(1):57. PubMed | Google Scholar
- Demographic and Health Surveys (DHS) & Multiple Indicator Cluster Surveys (MICS). Accessed 20th January, 2026.
- Amoah AN, Danquah AO, Stanislav TS, Drokow EK, Yacong B, Wang L. Correlates of dietary diversity among children aged 6-23 months of head porters in Ghana. Front Public Health. 2022 Nov 3;10:1020265. PubMed | Google Scholar
- United Nations Children's Fund (UNICEF). Infant and young child feeding (IYCF) data. 2026. Accessed 21th January, 2026.
- United Nations Children's Fund (UNICEF). Severe food poverty. Accessed 21st January, 2026.
- United Nations Children's Fund (UNICEF). Moderate food poverty. Accessed 22nd January, 2026.
- Ghana Statistical Service (GSS), Ghana Health Service (GHS), ICF Macro. Ghana Demographic and Health Survey 2008. 2009. Accessed 22nd January, 2026.
- Ghana Statistical Service (GSS), Ghana Health Service (GHS), ICF International. Ghana Demographic and Health Survey 2014. 2015. Accessed 23rd January, 2026.
- Ghana Statistical Service. Ghana Multiple Indicator Cluster Survey with an Enhanced Malaria Module and Biomarker, 2011, Final Report. 2012. Accessed 24th January, 2026.
- United Nations Children's Fund (UNICEF), The World Bank, UNDP, Korea International Cooperation Agency, USAID. Ghana Multiple Indicator Cluster Survey 2017/18. 2019. Accessed 25th January, 2026.
- United Nations Children's Fund. Diets. Accessed 25th January, 2026.
- World Health Organization. Indicators for assessing infant and young child feeding practices: definitions and measurement methods 2021. Accessed 26th January, 2026.
- The DHS Program. Methodology. 2024. Accessed 26th January, 2026.
- United Nations Children's Fund (UNICEF). Tools. Accessed 26th January, 2026.
- United Nations Children's Fund (UNICEF). Datasets. 2025. Accessed 26th January, 2026.
- Menber Y, Belachew T, Fentahun N. Minimum Dietary Diversity for Children aged 6-23 months as a predictor of micronutrient adequacy in Ethiopia: Validation of the proxy indicator. PLoS One. 2025 Oct 17;20(10):e0334827. PubMed | Google Scholar
- Masters WA, Bai Y, Herforth A, Sarpong DB, Mishili F, Kinabo J et al. Measuring the Affordability of Nutritious Diets in Africa: Price Indexes for Diet Diversity and the Cost of Nutrient Adequacy. Am J Agric Econ. 2018;100(5):1285-1301. PubMed | Google Scholar
- Darmon N, Drewnowski A. Contribution of food prices and diet cost to socioeconomic disparities in diet quality and health: a systematic review and analysis. Nutr Rev. 2015 Oct;73(10):643-60. PubMed | Google Scholar
- Antwi J, Quaidoo E, Ohemeng A, Bannerman B. Household food insecurity is associated with child's dietary diversity score among primary school children in two districts in Ghana. Food Nutr Res. 2022 Jan 7;66. PubMed | Google Scholar
- Tekeba B, Workneh BS, Zegeye AF, Gonete AT, Zeleke GA, Tamir TT. Minimum acceptable diet use and its associated factors among children aged 6-23 in Ghana: a mixed effect analysis using Ghana Demographic and Health Survey. Front Public Health. 2024 Sep 4;12:1402909. PubMed | Google Scholar
- World Health Organization. Indicators for assessing infant and young child feeding practices: part 1: definitions: conclusions of a consensus meeting held 6-8 November 2007 in Washington D.C., USA. 2008. Accessed 26th January, 2026.
- Frempong RB, Annim SK. Dietary diversity and child malnutrition in Ghana. Heliyon. 2017 May 3;3(5):e00298. PubMed | Google Scholar
- Belay DG, Taddese AA, Gelaye KA. Minimum acceptable diet intake and its associated factors among children age at 6-23 months in sub-Saharan Africa: a multilevel analysis of the sub-Saharan Africa demographic and health survey. BMC Public Health. 2022 Apr 7;22(1):684. PubMed | Google Scholar
- Opoku Agyemang G, Attu SS, Annan RA, Okonogi S, Sakura T, Asamoah-Boakye O. Factors associated with food consumption and dietary diversity among infants aged 6-18 months in Ashanti Region, Ghana. PLoS One. 2023 Nov 30;18(11):e0294864. PubMed | Google Scholar
- Saaka M, Larbi A, Mutaru S, Hoeschle-Zeledon I. Magnitude and factors associated with appropriate complementary feeding among children 6�23 months in northern Ghana. BMC Nutrition. 2016 Jan 9;2(1):2. Google Scholar
- Amugsi DA, Mittelmark MB, Oduro A. Association between Maternal and Child Dietary Diversity: An Analysis of the Ghana Demographic and Health Survey. PLoS One. 2015 Aug 25;10(8):e0136748. PubMed | Google Scholar
- Gatica-Domínguez G, Neves PAR, Barros AJD, Victora CG. Complementary Feeding Practices in 80 Low- and Middle-Income Countries: Prevalence of and Socioeconomic Inequalities in Dietary Diversity, Meal Frequency, and Dietary Adequacy. J Nutr. 2021 Jul 1;151(7):1956-1964. PubMed | Google Scholar
- United Nations Children's Fund. Child food poverty: nutrition deprivation in early childhood. 2024. Accessed 26th January, 2026.
Search
This article authors
On Pubmed
On Google Scholar
Citation [Download]
Navigate this article
Similar articles in
Key words
Tables and figures

Article metrics
Recently from the PAMJ


Authors´ services
