
Distal tibial trabecular morphometry in a sprague dawley rat model of fetal alcohol syndrome (FAS): a micro focus X-ray computed tomography case-control study
Robert Ndou, Nura Kaura Bello, Vaughan Perry, Diana Pillay
Corresponding author: Robert Ndou, Department of Anatomy and Histology, School of Medicine, Sefako Makgatho Health Sciences University, Ga-Rankuwa, Pretoria, South Africa 
Received: 02 Sep 2022 - Accepted: 06 Aug 2023 - Published: 25 Sep 2023
Domain: Biology,Cell biology,Histopathology
Keywords: Bone trabeculae morphology, tibia, osteoporosis, prenatal alcohol
©Robert Ndou et al. Pan African Medical Journal (ISSN: 1937-8688). This is an Open Access article distributed under the terms of the Creative Commons Attribution International 4.0 License (https://creativecommons.org/licenses/by/4.0/), which permits unrestricted use, distribution, and reproduction in any medium, provided the original work is properly cited.
Cite this article: Robert Ndou et al. Distal tibial trabecular morphometry in a sprague dawley rat model of fetal alcohol syndrome (FAS): a micro focus X-ray computed tomography case-control study. Pan African Medical Journal. 2023;46:35. [doi: 10.11604/pamj.2023.46.35.37151]
Available online at: https://www.panafrican-med-journal.com//content/article/46/35/full
Research 
Distal tibial trabecular morphometry in a sprague dawley rat model of fetal alcohol syndrome (FAS): a micro focus X-ray computed tomography case-control study
Distal tibial trabecular morphometry in a sprague dawley rat model of fetal alcohol syndrome (FAS): a micro focus X-ray computed tomography case-control study
![]() Robert Ndou1,&, Nura Kaura Bello2, Vaughan Perry1, Diana Pillay1
Robert Ndou1,&, Nura Kaura Bello2, Vaughan Perry1, Diana Pillay1
&Corresponding author
Introduction: intrauterine alcohol exposure has adverse health effects on the offspring, which may result in fetal Alcohol Spectrum Disorders (FASD). The neurological and craniofacial aspects have been well studied; however, long bones have received limited attention despite the short stature reported in FASD children.
Methods: time-mated (n=13) pregnant Sprague Dawley dams were assigned to either the ethanol (n=5), saline control (n=5) or untreated group (n=3) which received no treatment. The ethanol and saline control dams were treated with 0.015ml/g of 25.2% ethanol or 0.9% saline, respectively. Treatment was for the first 19 days of gestation. Two pups from each dam were used and terminated at 21 days of age. Paired tibiae were harvested. Each bone was scanned using a Nikon XTH 225L 3D-μCT to investigate trabeculae morphometry
Results: the ethanol group had less bone to total volume (BT/TV), thinnest trabeculae (TbTh) which were less spaced (TbSp) compared to the controls. However, number of trabecular (TbN) remained unaffected in all three groups. Tibial length was similar in all three groups; however, the distal metaphysis volume was smallest in the ethanol group. Logistic regression showed that distal trabecular separation was the main parameter affected the most in gestational alcohol in the tibia. The negative correlation of trabecular thickness and spacing in the ethanol group may be a contributor to bone weakness.
Conclusion: gestational alcohol exposure affects bone internal morphology in addition to the bone size. Overall, this study supports the findings clinical observation of small stature in FAS children.

Intrauterine alcohol exposure has adverse effects on the long-term health of the offspring, resulting in numerous problems described as Fetal Alcohol Spectrum Disorders (FASD). Fetal alcohol syndrome (FAS), characterized by neurological anomalies, craniofacial dysmorphology and growth retardation is the worst of these disorders [1]. The latter presents with, low body weight, short stature, and low weight to height ratio [2]. Presently, in South Africa, alcohol abuse prenatally is a growing concern. South Africa is reported to have the highest incidence (6%) of FAS worldwide [2]. This high prevalence may be the result of, poverty, socioeconomic status, and lack of education. This syndrome is regarded as a financial and social burden. Children with this condition need special schools and have a higher propensity to fractures and osteoporosis later in life. All these issues add to the burden of this condition, and it overwhelms the health system worldwide. Currently, in South Africa there is no surveillance system to monitor children with this condition thus many are misdiagnosed, which further contributes to the problem of this disease [3]. Gestational alcohol exposure may result in osteoporosis and increased fracture risk in adulthood; therefore, it is worth investigating the effects of prenatal alcohol exposure on bone microarchitecture [4]. Osteoporosis is characterized by a reduction in bone mass and disruption of trabecular and compact bone structure. Alcohol causes a reduction in compact and trabecular bone density and trabecular bone volume in rats [5]. Similarly, Chen et al. (2012) found a decrease in trabecular number in the hamster femur following alcohol consumption [6]. This is thought to be due to a decrease in the osteoblast number and size as previously reported in alcohol exposed rats [7]. The rationale for this study is on the premise that, in South Africa, it is common for women to binge-drink in secrecy while attempting to conceal this behavior from their spouses, families, and communities to avoid the public disgrace associated with women drinkers [8] in addition to the associated bone deficiencies. Considering this, the aim of this study was to investigate bone microarchitecture in a rat model that mimics binge-drinking. The specific objective was to obtain tibiae of 3-week-old rat pups from dams that were given alcohol in pregnancy. The other objective was to measure bone length (tibia), and trabecular morphometric parameters from Micro CT data. We propose that gestational alcohol may have a detrimental effect on bone trabecular morphometric parameters at 3 weeks´ postnatal life. This study will provide insight on the long-term effects of prenatal alcohol exposure with respect to bone, microarchitecture. The results may pave the way for development of future therapies to counteract the adverse effects of intrauterine alcohol exposure in postnatal skeletal development.

Study design: a case-control study which was designed and conducted to investigate the effect of gestational alcohol on the trabecular morphometric parameters of the Sprague Dawley rat tibia.
Study setting and group allocation: all study animals were bred and kept at the Central animal services (CAS), University of Witwatersrand, Johannesburg. These animals were kept under pathogen free conditions, temperature-controlled environment (23°C ±2°C) and a 12-hour light/dark cycle. Pregnant dams were individually housed in plastic cages, allowing free movement within. Access to tap water and standard rodent diet was unrestricted. Thirteen female virgin Sprague Dawley rats weighing between 260-350g were used to obtain 26 pups for the study. Dams (n=13) were allocated into either the ethanol (n=5), saline control (n=5) and untreated control groups (n=3). Fewer animals were used in this group (n=3) to reduce the number of animals required for the study. The ethanol and saline groups were treated with 0.015ml/g of either 25.2% ethanol or 9% saline, respectively, through oral gavage for 19 days from the first day of gestation, determined by the presence of a vaginal plug. The untreated control group received neither ethanol nor saline. The dams were allowed to litter naturally, and the pups remained with their dams until the age of 3 weeks before they were terminated by pentobarbital intraperitoneal injection. From each dam, 2 pups were used as follows: ethanol group (n=10), saline controls (n=10) and untreated controls (n=6). Upon termination, bilateral tibia were then individually immersed and stored in 10% buffered formalin to continue fixation until further processing. The sample sizes were chosen to enable adequate statistical analysis.
Variables: the variables in the study are given in Table 1 and an illustration of the parts of the tibia studied is given in Figure 1.
Data resource and management
Determination of blood alcohol levels: to monitor blood alcohol levels among the pregnant dams, blood from the tail vein was sampled into heparinized capillary tubes weekly, an hour after treatment for the saline control and ethanol dams. All blood samples were centrifuged, and serum was stored at -80�c until analyzed for BAC (Kit).
Three-dimensional micro-focus X-ray computed tomography (3D-μCT): the bones were individually wrapped in Styrofoam and placed in a plastic container. The scanning voltage was 70kv, the X-ray current was 400μa, with a frame averaging of 4 and a resolution of 15μm.
Bone morphometry: reconstruction was done using 3D Pro® after which VG studio Max® 3.0 was used for data analysis. The gray values representing the container were excluded using the import histogram. To ensure that only the bone material was being examined, manual surface determination was applied ascertaining that the background was removed without compromising the sample material of interest. The region of interest was then selected for surface determination.
Data collection: after selecting the distal epiphysis as a region of interest, the trabecular number, thickness, spaces and volume were obtained under “morphometrics” on VG studio. Bone length was obtained using the built-in caliper (Table 1).
Sample size suitability and bias: to determine the minimum number of pups required, sample size was estimated using the “resource equation” method as multiple endpoints were measured. This method measures the value “E”, which refers to the degrees of freedom of analysis of variance (ANOVA) and should be between 10 and 20 [9]. This value was calculated as follows: E = Total number of animals - total number of groups. Ethanol group E= (10x3)-3=27; saline groups: E= (10x3)-3=27; untreated group: E = (6x3)-3=15.
Statistical analysis: the data were managed in Microsoft Excel 365 (Microsoft Corporation) and analyzed using SPSS® version 28, IBM®, 2022. The saline and untreated groups saved as controls and were matched against the ethanol group which was exposed to the gestation alcohol. The untreated group controlled for confounding that could emanate from oral gavage. The Shapiro Wilks test was used to test for normality. Since the data were parametric, ANOVA with LSD post-hoc was used to test for group differences, with both the saline and untreated group compared again each other and against the ethanol group. Binary logistic regression was used to predict group membership into either the ethanol or saline control group and determine the parameters most affected by gestational alcohol to arrive at the observed outcome. Sensitivity was considered as the proportion of samples the regression model correctly classified into the correct grouping. The data are reported as mean ± standard deviation. Significance level was set at p < 0.05.
Ethical considerations: the study was approved by the Animal Ethics Committee, University of Witwatersrand (AESC 2015/27/15C) for use of animals.
Rat participants
Dams: the plasma alcohol concentration was calculated from dams in the saline (n=5) and ethanol group (n=5). No measurements were taken from the untreated group.
Bone samples: since 2 pups were used as follows: ethanol group (n=10), saline controls (n=10) and untreated controls (n=6), this provided double the number of tibiae in each group. Therefore, the tibia used were as follows: ethanol group (n=20), saline controls (n=20) and untreated controls (n=12).
Outcome data
Blood alcohol concentration: the plasma alcohol concentration for the saline control group was negative (or undetectable) whereas 81.53mg/dl was detected for the ethanol.
Bone length distal metaphysis volume: the mean full bone length was similar in all three groups studied (ethanol, mean=21.08mm ±0.95; saline control, mean=21.23mm ±1.38 and untreated control, mean=21.88mm ±0.94) (Figure 2 A). In contrast, the distal metaphysis volume showed differences between the study groups, with the ethanol group showing a significantly smaller volume (Mean=3.51mm3 ±1.07) than the saline (Mean=4.35 mm3 ±0.78) and untreated controls (Mean=4.26 mm3 ±1.02) (p=0.007 and p=0.04 for the ethanol group compared to the saline and untreated groups respectively) (Figure 2 B).
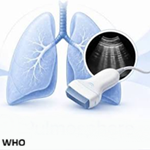
Trabecular morphometric parameters: the ethanol group (Mean=54.73% ±14.53) had less bone to total volume (BT/TV) compared to the saline (Mean=66.81% ±11.05) and untreated controls (Mean=68.83% ±15.35). This difference was significant for the ethanol and saline groups (p<0.001) (Figure 2 C). The ethanol group (Mean= 0.14 ±0.10) showed the thinnest trabeculae (TbTh) of all three groups in the study, being significantly lower than the saline controls (Mean= 0.20 ±0.08) (p=0.03) (Figure 2 D). The number of trabecular (TbN) was similar in all three groups (Figure 2 E) (ethanol, mean=5.04 ±1.70; saline control mean=5.46 ±1.32 and untreated control mean=5.48 ±0.61). However, differences in trabeculae spacing (TbSp) occurred (Figure 2 F), with the ethanol group (Mean=0.08mm ±0.04) (Figure 3 A) displaying less spacing than the saline (Mean=0.13mm ±0.06) (Figure 3 B) and untreated group (mean=0.13mm ±0.06) (Figure 3 C). These differences were statistically significant for both the ethanol and untreated controls (p=0.002 and p=0.02 for the ethanol group compared to the saline and untreated groups respectively).
Trabecular morphometric parameters discriminating the ethanol and saline groups: the effect of gestational ethanol on bone volume to total volume ratio, trabecular thickness, number, and separation was assessed using binary logistic regression in the ethanol and saline control groups as they had an adequate sample size for the analysis. The parameters used could reliably distinguish between the two groups. A test of the full model against a constant only model was statistically significant, indicating that the predictors as a set, reliably distinguished between ethanol or saline control group membership (Chi-square = 23.748, p < 0.001 with df = 4). Nagelkerke´s R2 of 0.577 indicated a moderately strong relationship between prediction and grouping. The Wald criterion demonstrated that only trabecular spacing (TbSp) predicted membership (Table 2). Prediction success overall was 78.6% (84.2% for the ethanol group and 73.9% saline controls) (Table 3).
The current study employed micro focus X-ray computed tomography to understand how prenatal alcohol exposure affects bone development in the Sprague-Dawley rat tibia. This in-turn results in diminished stature of the offspring [10-12]. Tibia length was unchanged, but the volume of the distal metaphysis was smaller in the ethanol group suggesting a diminished size in this dimension of the tibia. Logistic regression showed that distal trabecular separation was the main parameter affected the most in gestational alcohol in the tibia. There was a negative correlation of trabecular thickness and spacing in the ethanol group.
Osteometric and bone internal morphology: the bone length of the tibia was similar among all three groups in the study. In contrast, previous studies found shorter tibiae in the ethanol group [1,13,14]. In the present study, we used 25.2% ethanol whereas other researchers used a higher ethanol concentration of 36% in studies [1,13,14]. The effects of prenatal ethanol exposure on bone are dose dependent as [1,14,15] showed that 36% ethanol has more adverse effects on bone than 25% and 15% ethanol administered in gestation. A possibility exists that we could have found shorter bone in the alcohol group had we used a higher alcohol percentage. Considering the relatively high rate of alcohol metabolism in rats, these animals in our study were only exposed to ethanol for approximately 2 hours per day as that is the time it takes for rodents to metabolise ethanol [5, 14]. This, combined with the moderate dose of 25.2% ethanol could have possibly spared the animals from excessive harm. These results could potentially be different in humans as most people who drink during pregnancy are less educated and have lower socioeconomic status, which impacts their diet [8]. As the animals were on a nutritious balanced diet, this could have mitigated the effects of ethanol. Additionally, there was a 3-week postnatal period of no ethanol exposure which may have improved the chances of recovery in some respects such as bone length Streissguth et al. [16] and Spohr et al. [17] suggested that there is potential for catch up growth following prenatal exposure to ethanol. This proposition requires further studies to establish the facts.
Trabecular bone: in the present study, we found both lower bone volume to total volume (BV/TV) and trabecular thickness (Tb.Th) in the ethanol group in comparison with the controls. Having not seen differences in bone length among the three groups, we queried whether a size estimation method that includes more dimensions would yield the same observations. Linear measurements such as length are in a single dimension and as such tend to miss size information from other dimensions in three-dimensional space. We then, calculated the distal epiphyseal volume (part below the growth plate) as this is the portion rich in trabeculae. We found that the distal volume was significantly less in the ethanol group compared to the controls despite similar bone lengths. The trabecular number (TbN) was not affected in our study. This is similar to the findings of Maddalozzo et al. [18], who did not find any changes on the TbN in the distal tibial epiphysis. However, there was more trabecular spacing in the ethanol group. This, considered together with the lower BV/TV and TbTh in the ethanol group suggests that, although the bone length was similar in all groups, the internal morphology was not the same among the study groups. This means that prenatal alcohol exposure may affect internal architecture while sparing the external bone length. This disruption of the internal bone morphology may also explain why FAS children are prone to osteoporosis and fracture as they may have less bony material internally.
Parameters most affected by prenatal ethanol exposure: employing a binary logistic regression showed that the distal medullary canal area and trabecular spacing were the main parameters that determined group membership into either ethanol or saline control. This means that these two parameters (distal medullary canal area and trabecular spacing) are affected the most in gestational alcohol exposure. Our finding of a positive correlation between medullary canal area and cortical thickness indicates that the smaller medullary canal was coupled with thinner cortical bone. We propose that this may potentially explain weaker bones observed in FAS children. The negative correlation of trabecular thickness and spacing in the ethanol group indicates that thin trabecular occurred with more spacing in between. This would contribute to bone weakness. Our findings add light to the question of how osteoporosis and subsequent propensity to fracture may occur in prenatal alcohol exposure.
Limitations: the study was conducted in a laboratory and as such environmental factors were controlled. In contrast, life outside the laboratory such as human life may involve confounding environmental factors that may yield a different outcome. For example, physical activity may influence bone structural properties. A controlled alcohol dosage was administered; however, humans may drink variable amounts of alcohol. Fewer animals were used in the untreated group to reduce the number of animals required but equal samples would have minimized bias. As the untread group had fewer animals, we could only conduct binary logistic regression for the saline and ethanol group.
Logistic regression showed that the distal trabecular separation was the main parameters affected the most in gestational alcohol in the tibia. The negative correlation of trabecular thickness and spacing in the ethanol group may be a contributor to bone weakness. These findings show that in-utero alcohol affects bone internal morphology in addition to the bone size.. Overall, this study supports the clinical observation of small stature in FAS children.
What is known about this topic
- There has been much research on the neurological anomalies and craniofacial dysmorphology in FASD with limited research on bone growth retardation;
- Most researches on FASD have focused on the effects of gestational alcohol exposure on fetuses with limited information on its effects on posetnatal life.
What this study adds
- This study adds information that intrauterine alcohol exposure disturbs internal microarchitecture resulting in lower bone volume to total volume (BV/TV) and trabecular thickness (Tb.Th) following prenatal alcohol exposure;
- These findings show that gestational alcohol exposure affects bone internal morphology in addition to the bone size. Overall, tOverall, this study supports the clinical observation of small stature in FAS children.
The authors declare no competing interests.
Study conceptualization: Robert Ndou, Diana Pillay. Study design: Robert Ndou, Diana Pillay; research question formulation: Robert Ndou, Diana Pillay, Nura Kaura Bello, Vaughan Perry; data collection and analysis: Robert Ndou, Diana Pillay, Nura Kaura Bello, Vaughan Perry; writing and submitting manuscript: Robert Ndou, Diana Pillay. All the authors have read and agreed to the final manuscript.
This research was funded by the National Research Foundation of South Africa; Grant number: TTK160826186551.
Table 1: trabecular parameters assessed
Table 2: trabecular morphometric variables in the equation
Table 3: group membership classification from trabecular morphometric parameters
Figure 1: parts of the tibia studied; A) tibial length
Figure 2: osteometric measurements and trabeculae morphometric parameters of the distal tibiae; A) full bone length; B) epicondylar breadth; represented as means for the saline control and ethanol group; C) bone to total volume (BV/TV); D) trabeculae thickness (TbTh); E) trabeculae number (TbN) and F) trabeculae spacing (TbSp) represented at the distal epiphysis of the tibia; error bars represent standard deviation
Figure 3: trabecular morphology; representative slices of: A) distal end in an untreated control showing more trabeculae and less spacing; B) distal end in a saline control showing moderate trabeculae and spacing; C) distal end of the ethanol group showing fewer trabeculae and wider spacing
- Simpson ME, Duggal S, Keiver K. Prenatal ethanol exposure has differential effects on fetal growth and skeletal ossification. Bone. 2005 Mar;36(3):521-32 PubMed | Google Scholar
- O´Leary CM. Fetal alcohol syndrome: Diagnosis, epidemiology, and developmental outcomes. J Paediatr Child Health. 2004 Jan-Feb;40(1-2):2-7. PubMed | Google Scholar
- May PA, Blankenship J, Marais AS, Gossage JP, Kalberg WO, Barnard R et al. Approaching the prevalence of the full spectrum of fetal alcohol spectrum disorders in a South African population-based study. Alcohol Clin Exp Res. 2013; 37(5):818-830. PubMed | Google Scholar
- Soares EV, Fávaro WJ, Cagnon VHA, Bertran CA, Camilli JA. Effects of alcohol and nicotine on the mechanical resistance of bone and bone neoformation around hydroxyapatite implants. J Bone Miner Metab. 2010;28(1):101-7. PubMed | Google Scholar
- Sampson HW, Perks N, Champney TH, DeFee B. Alcohol consumption inhibits bone growth and development in young actively growing rats. Alcohol Clin Exp Res. 1996 Nov;20(8):1375-84. PubMed | Google Scholar
- Chen G, Deng C, Li Y-P. TGF-β and BMP signaling in osteoblast differentiation and bone formation. Int J Biol Sci. 2012;8(2):272-88. PubMed | Google Scholar
- Diez A, Serrano S, Cucurull J, Marinoso L, Bosch J, Puig J et al. Acute effects of ethanol on mineral metabolism and trabecular bone in Sprague-Dawley rats. Calcif Tissue Int. 1997 Aug;61(2):168-71. PubMed | Google Scholar
- Conover EA, Jones KL. Safety concerns regarding binge drinking in pregnancy: A review. Birth Defects Res A Clin Mol Teratol. 2012 Aug;94(8):570-5. PubMed | Google Scholar
- Charan J, Kantharia ND. How to calculate sample size in animal studies? J Pharmacol Pharmacother. 2013 Oct;4(4):303-6. PubMed | Google Scholar
- Chakkalakal DA, Novak JR, Fritz ED, Mollner TJ, McVicker DL, Lybarger DL et al. Chronic ethanol consumption results in deficient bone repair in rats. Alcohol Alcohol. 2002 Jan-Feb;37(1):13-20. PubMed | Google Scholar
- Keiver K, Weinberg J. Effect of duration of maternal alcohol consumption on calcium metabolism and bone in the fetal rat. Alcohol Clin Exp Res. 2004;28(3):456-67. PubMed | Google Scholar
- Ramadoss J, Hogan HA, Given JC, West JR, Cudd TA. Binge alcohol exposure during all three trimesters alters bone strength and growth in fetal sheep. Alcohol. 2006 Apr;38(3):185-92. PubMed | Google Scholar
- Miralles-Flores C, Delgado-Baeza E. Histomorphometric analysis of the epiphyseal growth plate in rats after prenatal alcohol exposure. J Orthop Res. 1992 May;10(3):325-36. PubMed | Google Scholar
- Snow ME, Keiver K. Prenatal ethanol exposure disrupts the histological stages of fetal bone development. Bone. 2007 Aug;41(2):181-7. PubMed | Google Scholar
- Turner RT, Kidder LS, Kennedy A, Evans GL, Sibonga JD. Moderate alcohol consumption suppresses bone turnover in adult female rats. J Bone Miner Res. 2001 Mar;16(3):589-94. PubMed | Google Scholar
- Streissguth A, Aase JM, Clarren SK, Randels SP, LaDue RA, Smith DF. Fetal alcohol syndrome in adolescents and adults. JAMA. 1991 Apr 17;265(15):1961-7. PubMed | Google Scholar
- Spohr HL, Willms J, Steinhausen HC. Prenatal alcohol exposure and long-term developmental consequences. Lancet. 1993 Apr 10;341(8850):907-10. PubMed | Google Scholar
- Maddalozzo GF, Turner RT, Edwards CH, Howe KS, Widrick JJ, Rosen CJ, Iwaniec UT. Alcohol alters whole body composition, inhibits bone formation, and increases bone marrow adiposity in rats. Osteoporos Int. 2009 Sep;20(9):1529-38. PubMed | Google Scholar
Search
This article authors
On Pubmed
On Google Scholar
Citation [Download]
Navigate this article
Similar articles in
Key words
Tables and figures


Article metrics
Recently from the PAMJ


Authors´ services
