
The pattern and trend of COVID-19 spread in the Eastern Mediterranean Region: curve-fitting models estimation
Mohannad Abed Alfattah Al Nsour, Yousef Saleh Khader, Haitham Majed Nazzal
Corresponding author: Yousef Saleh Khader, Department of Public Health, Jordan University of Science and Technology, Jordan 
Received: 02 May 2020 - Accepted: 22 May 2020 - Published: 08 Jun 2020
Domain: Epidemiology,Infectious diseases epidemiology,Public health
Keywords: COVID-19, pattern, Eastern Mediterranean Region
This article is published as part of the supplement PAMJ Special issue on COVID - 19 in Africa, commissioned by The Pan African Medical Journal.
©Mohannad Abed Alfattah Al Nsour et al. Pan African Medical Journal (ISSN: 1937-8688). This is an Open Access article distributed under the terms of the Creative Commons Attribution International 4.0 License (https://creativecommons.org/licenses/by/4.0/), which permits unrestricted use, distribution, and reproduction in any medium, provided the original work is properly cited.
Cite this article: Mohannad Abed Alfattah Al Nsour et al. The pattern and trend of COVID-19 spread in the Eastern Mediterranean Region: curve-fitting models estimation. Pan African Medical Journal. 2020;35(2):68. [doi: 10.11604/pamj.supp.2020.35.2.23269]
Available online at: https://www.panafrican-med-journal.com//content/series/35/2/68/full
Research 

The pattern and trend of COVID-19 spread in the Eastern Mediterranean Region: curve-fitting models estimation
The pattern and trend of COVID-19 spread in the Eastern Mediterranean Region: curve-fitting models estimation
Mohannad Abed Alfattah Al Nsour1, Yousef Saleh Khader2,&, Haitham Majed Nazzal1
1Global Health Development/Eastern Mediterranean Public Health Network, Jordan, 2Department of Public Health, Jordan University of Science and Technology, Jordan
&Corresponding author
Yousef Saleh Khader, Department of Public Health, Jordan University of Science and Technology, Jordan
Introduction: this study aimed to use the Curve Estimation Procedure to assess the pattern and trend of COVID-19 spread in the countries of the Eastern Mediterranean Region (EMR) by finding the model best fit for the observed COVID-19 data in each country between 20 February 2020-21 April 2020.
Methods: the number of daily confirmed COVID-19 cases, recovered cases, and during the period 20 February 2020-21 April 2020 in 21 countries in EMR were extracted from the WHO situation reports. The Curve Estimation procedure was used to produce different curve estimation regression models for the observed data in each country.
Results: during this observed period, the total number of confirmed cases, recovered cases, and deaths in the region were 138673, 71343, and 6291, respectively. The overall fatality rate in the region was 4.5%. The quadratic model and the cubic model follows the observed data points fairly well during the observed time period in five and nine countries, respectively. The exponential model (Y = b0 * (e**(b1 * t))), the growth model (Y = e**(b0 + (b1 * t))), and the compound model (Y = b0 * (b1**t)) were the best fit for data during the observed time period in two, three, and two countries, respectively.
Conclusion: the pattern of COVID-19 spread differed between countries in the EMR. This might reflect the variations in testing and implementation of public health measures. The best curve-fitting model was demonstrated for each country and it can be used for very short-term predictions.

As of 25th April 2020, 159157 people are confirmed to be infected in The Eastern Mediterranean Region (EMR). While around 82160 cases are already recovered in the EMR, the death toll reached to over 152,328 [1]. Epidemiological models during outbreaks are very helpful for policy makers and public health professionals to make key decisions about the appropriate public health measures and interventions. During COVID-19, many models were developed to help in making decisions on social distancing measures, testing and contact tracing, training of health professionals, resources needed, utilization of resources within a health system, and measures that should be taken to reduce COVID-19´s impact. Depending on the purpose of epidemiological models, they can be used to describe the current situation, predict what could happen in the next week or month, and assess the effectiveness of preventive measures. Curve fitting, also known as regression analysis, is used to find the “best fit” line or curve for a series of data points. It is the process of specifying the model that provides the best fit to the specific curves in the dataset and it can be used as an aid for data visualization [2,3]. This study aimed to use the Curve Estimation Procedure to assess the pattern and trend of COVID-19 spread in the countries of the EMR by finding the model that best fit the observed COVID-19 data in each country between 20 February 2020-21 April 2020.

The number of daily confirmed COVID-19 cases, recovered cases, and deaths during the period 20 February 2020-21 April 2020 in Eastern Mediterranean countries were extracted from the World Health Organization situation reports [4]. All countries of the EMR are included except Yemen because only one case was reported during the observed period. Data were entered in the IBM SPSS version 24 (IBM Corp. Released 2016. IBM SPSS Statistics for Windows, Version 24.0. Armonk, NY: IBM Corp.) The Curve Estimation procedure was used to produce different curve estimation regression models for the observed data in each country. In all models, the dependent variable (Y) was the number of confirmed cases and the independent variable was time (t). A total of 11 regression models were tested and compared to find the model that best fits the COVID-19 data during the observed period for each country: 1) Linear. Model whose equation is Y = b0 + (b1 * t). The daily confirmed COVID-19 cases were modeled as a linear function of time. 2) Logarithmic. Model whose equation is Y = b0 + (b1 * ln(t)). 3) Inverse. Model whose equation is Y = b0 + (b1 / t). 4) Quadratic. Model whose equation is Y = b0 + (b1 * t) + (b2 * t**2). 5) Cubic. Model that is defined by the equation Y = b0 + (b1 * t) + (b2 * t**2) + (b3 * t**3). 6) Power. Model whose equation is Y = b0 * (t**b1) or ln(Y) = ln(b0) + (b1 * ln(t)). 7) Compound. Model whose equation is Y = b0 * (b1**t) or ln(Y) = ln(b0) + (ln(b1) * t). 8) S-curve. Model whose equation is Y = e** (b0 + (b1/t)) or ln(Y) = b0 + (b1/t). 9) Logistic. Model whose equation is Y = 1 / (1/u + (b0 * (b1**t))) or ln(1/y-1/u) = ln (b0) + (ln(b1) * t) where u is the upper boundary value. 10) Growth. Model whose equation is Y = e** (b0 + (b1 * t)) or ln(Y) = b0 + (b1 * t). 11) Exponential. Model whose equation is Y = b0 * (e**(b1 * t)) or ln(Y) = ln(b0) + (b1 * t). The R Square statistic was used to measure the strength of relationship between the model and the dependent variable. The standard error of the regression was used to compare fits between these types of models. A small standard error of the regression indicates that the data points are closer to the fitted values. After fitting a regression model, the residual plots were checked to be sure that we have unbiased estimates.
Table 1 shows the number of confirmed COVID-19 cases, recovered cases, and COVID-19 specific deaths during the period 20 February- 21 April, 2020 in 21 Eastern Mediterranean countries. The first confirmed cases in the region were observed in Iran and Egypt on 20 February 2020. During this observed period, the total number of confirmed cases in the region was 138673, the total number of recovered cases was 71343, and the number of deaths from COVID-19 was 6291. The case fatality rate ranged from 0.14% in Qatar to 11.21% in Sudan. The overall fatality rate in the region was 4.5%.
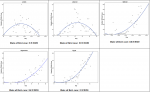
Curve fitting: a scatterplot of the reported COVID-19 cases for each country revealed that the relationship is nonlinear in all countries. Table 2 shows the summary of best fitting model and the parameters estimates for each country. For each country, the model that has high values of R Square and Adjusted R Square and low values of the standard error of the estimates was selected. Other models were tested but they presented average to poor fit, despite that some models were significant. The quadratic model (Y = b0 + (b1 * t) + (b2 * t**2)) follows the observed data points fairly well during the observed time period in five countries: Jordan, Lebanon, Djibouti, Afghanistan, and Egypt (Figure 1). The pattern of the daily confirmed cases in Jordan is similar to that in Lebanon. The quadratic terms were negative for the models in Jordan and Lebanon which clearly indicate that the number of cases increased initially until a turning point was reached. Beyond that value, the number of cases decreased over time. On the other hand, the quadratic terms were negatives for models fitted for the cases in Afghanistan, Djibouti, and Egypt which indicates that the net increase in the number of cases is a greater than linear increase.
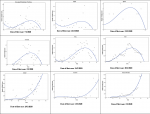
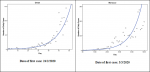
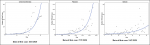
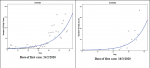
The cubic model (Y = b0 + (b1 * t) + (b2 * t**2) + (b3 * t**3)) follows the observed data points fairly well during the observed time period in nine countries: Occupied Palestinian Territory, Iran, Iraq, Tunisia, Sudan, Syria, Qatar, Libya, and Saudi Arabia (Figure 2). The patterns in Occupied Palestinian Territory and Libya were similar. After few initial cases, the number of cases decreased until a turning point and then increased. After another turning point, the number started to decrease. In Qatar, Sudan and Saudi Arabia, the number of cases are still increasing as of the last observed date. The exponential model (Y = b0 * (e**(b1 * t))) follows the observed data points fairly well during the observed time period in two countries: Oman and Morocco (Figure 3). In the two counties, the number of cases grows exponentially, or grows at an increasingly larger rate over time. In United Arab Emirates, Pakistan, and Bahrain, the growth model (Y = e**(b0 + (b1 * t))) was the best fit for the during the observed time period (Figure 4). The compound model (Y = b0 * (b1**t)) was the best fit for the data during the observed time period in Somalia and Kuwait (Figure 5).
The findings of this study are valuable to aid policy makers and healthcare professionals to use the best models and regression equations to predict future cases in their countries. The study demonstrated the best curve-fitting model for each country. To make predictions, these curve-fitting models and regression equations can be used to extrapolate curves into the future. However, curve-fitting models are useful for making very short-term predictions. Looking for how the pandemic will be at longer-term, attention should be paid to transmission models after considering their own built-in uncertainties. The pattern of COVID-19 spread differed between countries in the EMR. However, the interpretation of the inter-country differences in the trends and patterns of COVID-19 spreads is problematic because these countries varied in their capacities of testing and in the implementation of public health measure for prevention and control such as social physical, isolation, sanitation and use of personal protective measure. Therefore, surges in confirmed cases could reflect more testing is being done or actual increase in infections.
Some of the countries of the region have implemented public measures such as rapid case identification, rapid testing and isolation of cases, contact tracing and have introduced widespread physical distancing measures and movement restriction. Consequently, the number of COVID-19 cases in some countries was suppressed below the threshold at which health systems become unable to prevent excess mortality. For these countries, there should be a plan for a phased transition to reduce such restrictions in a manner that will enable the sustainable suppression of transmission at a low-level whilst enabling the resumption of some parts of economic and social life. For other countries where community transmission has led to outbreaks with near exponential growth, widespread population-level physical distancing measures and movement restrictions are needed in order to slow spread and set in place other control measures. For countries that currently have few reported cases such as Yemen, there is a need to explore the situation closer and an opportunity to learn lessons from other countries that succeeded to contain the transmission of the disease. New measures that could provide good or better protection with less social cost are urgently needed [5].
The pattern of COVID-19 spread differed between countries in the EMR. This might reflect the variations in testing and implementation of public health measure for prevention and control. The best curve-fitting model was demonstrated for each country that can be used for making very short-term predictions.
What is known about this topic
- Epidemiological models during outbreaks are very helpful for policy makers and public health professionals to make key decisions about the appropriate public health measures and interventions.
What this study adds
- The trend of the reported COVID-19 cases is nonlinear in all countries in the Eastern Mediterranean Region;
- The number of COVID-19 cases in some countries in the Eastern Mediterranean Region was suppressed below the threshold at which health systems become unable to prevent excess mortality.
The authors declare no competing interests.
All authors contributed equally to the conception and design, acquisition of data, analysis, interpretation of data, and drafting and revising of the article.
Table 1: the number of confirmed COVID-19 cases, recovered cases, and COVID-19 specific deaths during the period 20 February- 21 April, 2020 in Eastern Mediterranean countries
Table 2: the summary of best fitting model and the parameters estimates for each country
Figure 1: the quadratic models that best fit the observed number of COVID-19 cases until 21th April 2020 in Jordan, Lebanon, Djibouti, Afghanistan, and Egypt (Y = b0 + (b1 * t) + (b2 * t**2))
Figure 2: the cubic models that best fit the observed number of COVID-19 cases until 21th April 2020 in Occupied Palestinian Territory, Iran, Iraq, Tunisia, Sudan, Syria, Qatar, Libya, and Saudi Arabia (Y = b0 + (b1 * t) + (b2 * t**2) + (b3 * t**3))
Figure 3: the exponential models that best fit the observed number of COVID-19 cases until 21thApril 2020 in Oman and Morocco (Y = b0 * (e**(b1 * t)))
Figure 4: the growth models that best fit the observed number of COVID-19 cases until 21th April 2020 in United Arab Emirates, Pakistan, and Bahrain (Y = e**(b0 + (b1 * t)))
Figure 5: the compound models that best fit the observed number of COVID-19 cases until 21th April 2020 in Somalia and Kuwait (Y = b0 * (b1**t))
- World Health Organization. COVID-19 situation in the Region-total reports. Situation as of 7 June (18:00:00 PM). Accessed 25 April 2020.
- Sandra Lach Arlinghaus. PHB Practical Handbook of Curve Fitting. CRC Press, 1994. Google Scholar
- Chernov N. Circular and linear regression: Fitting circles and lines by least squares, Chapman & Hall/CRC. Monographs on Statistics and Applied Probability. 2010;117:256.
- World Health Organization. Coronavirus disease 2019/Situation reports. Accessed 21 April 2020.
- Peak CM, Childs LM, Grad YH, Buckee CO. Comparing nonpharmaceutical interventions for containing emerging epidemics. Proc Natl Acad Sci. 2017 Apr 11;114(15):4023-4028. PubMed | Google Scholar
Search
This article authors
On Pubmed
On Google Scholar
Citation [Download]
Navigate this article
Similar articles in
Key words
Tables and figures

This supplement
Article metrics
Recently from the JOURNAL_ABBREVIATION


Authors´ services
