
Observational study on the characteristics of COVID-19 transmission dynamics during the first wave of the epidemic in Lusaka, Zambia
Millica Phiri,Tadatsugu Imamura, Patrick Sakubita, Nelia Langa, Moses Mulenga, Marian Matipa Mulenga, George Kapapi, Michael Mwamba, Jane Nalwimba, Deborah Tembo, Kingsley Keembe, Karen Moompizho, Nkomba Kayeyi, William Ngosa, Davie Simwaba, Paul Msanzya Zulu, Fred Kapaya, Raymond Hamoonga, Mazyanga Lucy Mazaba, Nyambe Sinyange, Muzala Kapina, Chie Nagata, Nathan Kapata, Akira Ishiguro, Victor Mukonka
Corresponding author: Tadatsugu Imamura, Japan International Cooperation Agency, Tokyo, Japan 
Received: 09 Aug 2022 - Accepted: 17 Jan 2024 - Published: 04 Jun 2024
Domain: Infectious diseases epidemiology
Keywords: COVID-19, contact tracing, secondary transmission, secondary attack rate, overdispersion, super-spreading events, Africa
©Millica Phiri et al. Pan African Medical Journal (ISSN: 1937-8688). This is an Open Access article distributed under the terms of the Creative Commons Attribution International 4.0 License (https://creativecommons.org/licenses/by/4.0/), which permits unrestricted use, distribution, and reproduction in any medium, provided the original work is properly cited.
Cite this article: Millica Phiri et al. Observational study on the characteristics of COVID-19 transmission dynamics during the first wave of the epidemic in Lusaka, Zambia. Pan African Medical Journal. 2024;48:42. [doi: 10.11604/pamj.2024.48.42.36724]
Available online at: https://www.panafrican-med-journal.com//content/article/48/42/full
Research 
Observational study on the characteristics of COVID-19 transmission dynamics during the first wave of the epidemic in Lusaka, Zambia
Observational study on the characteristics of COVID-19 transmission dynamics during the first wave of the epidemic in Lusaka, Zambia
Millica Phiri1,2, Tadatsugu Imamura3,4,&, ![]() Patrick Sakubita1,2, Nelia Langa1,2, Moses Mulenga1,2, Marian Matipa Mulenga1,2, George Kapapi1,2, Michael Mwamba1,2, Jane Nalwimba1,2,
Patrick Sakubita1,2, Nelia Langa1,2, Moses Mulenga1,2, Marian Matipa Mulenga1,2, George Kapapi1,2, Michael Mwamba1,2, Jane Nalwimba1,2, ![]() Deborah Tembo1,2, Kingsley Keembe1,2, Karen Moompizho1,2, Nkomba Kayeyi2, William Ngosa2, Davie Simwaba2,
Deborah Tembo1,2, Kingsley Keembe1,2, Karen Moompizho1,2, Nkomba Kayeyi2, William Ngosa2, Davie Simwaba2, ![]() Paul Msanzya Zulu2, Fred Kapaya2,
Paul Msanzya Zulu2, Fred Kapaya2, ![]() Raymond Hamoonga2, Mazyanga Lucy Mazaba2, Nyambe Sinyange2, Muzala Kapina2,
Raymond Hamoonga2, Mazyanga Lucy Mazaba2, Nyambe Sinyange2, Muzala Kapina2, ![]() Chie Nagata4, Nathan Kapata2, Akira Ishiguro4,
Chie Nagata4, Nathan Kapata2, Akira Ishiguro4, ![]() Victor Mukonka2
Victor Mukonka2
&Corresponding author
Introduction: coronavirus disease 2019 (COVID-19) transmission dynamics in the communities of low- and middle-income countries, particularly sub-Saharan African countries, are still not fully understood. This study aimed to determine the characteristics of COVID-19 secondary transmission during the first wave of the epidemic (March-October 2020) in Lusaka, Zambia.
Methods: we conducted an observational study on COVID-19 secondary transmission among residents in Lusaka City, between March 18 and October 30, 2020. We compared the secondary attack rate (SAR) among different environmental settings of contacts and characteristics of primary cases (e.g, demographics, medical conditions) by logistic regression analysis.
Results: out of 1862 confirmed cases of COVID-19, 272 primary cases generated 422 secondary cases through 216 secondary transmission events. More contacts and secondary transmissions were reported in planned residential areas than in unplanned residential areas. Households were the most common environmental settings of secondary transmission, representing 76.4% (165/216) of secondary transmission events. The SAR in households was higher than the overall events. None of the environmental settings or host factors of primary cases showed a statistically significant relationship with SAR.
Conclusion: of the settings considered, households had the highest incidence of secondary transmission during the first wave in Lusaka, Zambia. The smaller proportion of contacts and secondary transmission in unplanned residential areas might have been due to underreporting of cases, given that those areas are reported to be vulnerable to infectious disease outbreaks. Continuous efforts are warranted to establish measures to suppress COVID-19 transmission in those high-risk environments.

Coronavirus disease 2019 (COVID-19), which is caused by severe acute respiratory syndrome virus type 2 (SARS-CoV-2), was first identified in patients with pneumonia of unknown etiology in December 2019 [1,2]. The number of cases reported from different parts of the world increased rapidly, and the World Health Organization characterized the global spread of COVID-19 as a pandemic on March 11, 2020 [3]. In Zambia, the first two cases of COVID-19 were identified with a history of international travel on March 18, 2020 [4]. Zambia experienced its first surge of cases between July and September 2020, (i.e., the first wave), in which the capital city Lusaka was one of the most affected areas in the country [5]. In the effort to contain such a surge of cases in the community, transmission dynamics of COVID-19 have been intensively studied in different parts of the world. It is widely known that COVID-19 spreads in overdispersion patterns, in which 10% of cases become the source of 80% of new infections (e.g., superspreading events (SSE)) [6,7].
It was previously reported that environmental settings associated with the “three Cs” (i.e., crowded places, close-contact settings, confined and enclosed spaces) were likely to generate SSE and transmission of COVID-19 (e.g., workplaces, restaurants, bars, gyms, and churches) [8-11]. Identification of these risk environments for SSE and transmission led to establishment of targeted public health interventions (e.g., temporary closures of restaurants and bars, physical distancing, and wearing masks in houses of worship) to suppress COVID-19 transmission in the community [12-14]. Host factors were also intensively studied as being one of the potential driving forces of COVID-19 transmission [15]. Most of this valuable information was reported from high-income countries (HICs). Transmission dynamics of COVID-19 in low- and middle-income countries (LMICs), including sub-Saharan African countries, are assumed to be different from those in HICs. This is because of the highly varied cultural, socioeconomic, and political backgrounds which potentially affect the behavioral patterns of infected patients, environmental settings of contacts, and timeliness of implementation of mitigation measures [16]. However, numbers of reports describing the transmission dynamics of COVID-19 in LMICs, particularly those in sub-Saharan African countries, are still very limited. In this study, we aim to determine the characteristics of COVID-19 transmission dynamics and risk factors associated with secondary attack rates (SAR) in the community during the first wave of the epidemic in Lusaka, Zambia.

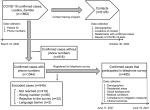
Contact tracing program and COVID-19 testing in Lusaka, Zambia: we conducted a retrospective data analysis of COVID-19 cases and their contacts identified in Lusaka City, the capital city of Zambia, between March 18 and October 30, 2020. The Ministry of Health, Zambia (MoH) through the Zambia National Public Health Institute (ZNPHI) has implemented a nationwide contact tracing program for COVID-19 cases since the first case identification on March 18, 2020 [17,18]. Confirmation of COVID-19 cases was conducted by polymerase chain reaction (PCR) or point-of-care antigen testing using nasopharyngeal swabs that were carried out at COVID-19 testing laboratories designated by MoH and ZNPHI. Following the national guidelines, a person who had contact with a confirmed case within 48 hours before the symptom onset to 14 days after the collection of SARS-CoV-2 positive samples was defined as a contact [19]. If a confirmed case was asymptomatic, the timing of collection of SARS-CoV-2 positive samples was used instead of that of the symptom onset [19]. Contacts were requested to conduct a self-quarantine (i.e., 10 days if they were asymptomatic) and subsequently subjected to COVID-19 testing when they developed symptoms or had suspected infections [19]. Information collected from confirmed cases and their contacts was summarized in the COVID-19 contact tracing database. The COVID-19 contact tracing database contained information including contact tracing identifiers and phone numbers of confirmed cases, geographical locations and environmental settings of the contact, the relationship between the confirmed cases and contacts, and age, gender, and results of COVID-19 testing of contacts (Figure 1).
Telephone survey for confirmed cases of COVID-19: to collect background information on confirmed cases of COVID-19, we conducted a telephone survey for previously confirmed cases whose phone numbers were available in the COVID-19 contact tracing database. COVID-19 cases identified through contact tracing efforts of MoH and ZNPHI between March 18 and October 30, 2020, were all eligible for this survey. This survey was not a part of the routine COVID-19 contact follow-ups of MoH and ZNPHI. Trained telephone surveyors called the phone numbers between June 11 and 18, 2021 (Figure 1). We collected information about the confirmed cases including age at the time of COVID-19 diagnosis, gender, residential areas, highest education level, underlying medical conditions, presence of symptoms at the time of diagnosis, attendance to public gatherings and crowded places (i.e., schools, bars and restaurants, malls and markets, hospitals, parties, churches, weddings, funerals) before diagnosis, compliance to wearing masks before diagnosis, compliance to self-quarantine after symptom onset and diagnosis, and clinical outcomes (i.e., hospitalization, intensive care unit (ICU), oxygen therapy, non-invasive positive pressure ventilation (NPPV), high flow nasal cannula (HFNC), ventilation, fatal outcomes). This survey was approved by the Zambia National Health Research Authority (reference number NHRA00001/24/05/2021), and the interview was conducted only after obtaining verbal informed consent from patients in confirmed cases or their family members for participating in the study. If the patients in confirmed cases were younger than 18 years old, verbal informed assent was obtained from them, after which verbal informed consent was obtained from their adult family members or guardians.
Secondary transmission analysis: secondary transmission was defined as the identification of new COVID-19 cases among contacts of confirmed cases. Confirmed cases that generated new cases among contacts were defined as primary cases, and the new cases that acquired infection from these primary cases were defined as secondary cases. These definitions were developed from previous studies on secondary transmissions of COVID-19, although the date of symptom onset was not available in our study; the date of confirmation of a positive COVID-19 test was used instead [20,21]. Secondary cases were confirmed to have the same or later dates of confirmation than primary cases. Environmental settings of secondary transmissions were determined based on the information from secondary cases regarding the settings where contacts between primary and secondary cases took place. Secondary transmission which occurred at one environmental setting was counted as one secondary transmission event. If one primary case generated secondary cases in two different environmental settings, the primary case was regarded as generating two secondary transmission events. Secondary attack rates were calculated by dividing the number of secondary cases by the number of contacts for each secondary transmission event.
Geospatial mapping of COVID-19 cases and contacts: residential addresses for confirmed cases were collected by the telephone survey. Geographical locations where contacts occurred were collected by physical visits and recordings of the geo-coordinates of the locations were part of the routine contact tracing activities. Digital maps of Lusaka showing the geographical distribution of COVID-19 cases and their contacts were developed using QGIS version 3.10 A Coruña. Township boundaries were accessed through the Zambia Data Hub where they were provided for download by the Ministry of Lands, the Office of Surveyor General. In Zambia, planned residential areas are those officially created by the Government Planning Authority, whereas unplanned residential areas are not. Unplanned residential areas include large numbers of compounds (i.e., informal settlement areas for low-income residents), which are characterized by a high population density, inadequate access to water, sanitation, and hygiene (WASH), and a high incidence of infectious disease outbreaks (e.g., cholera) [22,23]. The geographical distribution of planned and unplanned residential areas was generated and published by Zambia Data Hub [24]. The number of confirmed cases, contacts, and secondary cases were calculated for each of these 94 townships using QGIS.
Statistical analysis: it was conducted using R ver.3.5.0 (R Foundation for Statistical Computing, Vienna, Austria). We performed univariate logistic regression analysis to calculate the odds ratio and the 95% confidence interval (95%CI) between SAR and characteristics of cases and contacts. The Wilcoxon rank sum test was performed to compare continuous variables (e.g., numbers of cases and contacts) between planned and unplanned residential areas. A p-value less than 0.05 was considered statistically significant.
Ethics clearance: ethics approval for conducting the telephone survey and the use of patients´ data collected as part of the public health response of ZNPHI and MoH for scientific analysis and publication was obtained from the Zambia National Health Research Authority (reference numbers NHRA00001/24/05/2021 and NHRA00002/05/05/2022, respectively).
Contact tracing program for COVID-19 in Lusaka, Zambia: through the contact tracing program in Lusaka City, 1862 confirmed cases were identified in Lusaka, Zambia between March 18 and October 31, 2020. These cases represented 83.0% (1862/2244) of the total laboratory-confirmed cases in Lusaka in the same period. In the contact tracing program, a total of 6128 contacts were identified. The number of contacts per confirmed case was between 1 and 9 for 94.6% (1762/1862), 10-19 for 3.0% (55/1862), 20-29 for 1.2% (22/1862), 30-39 for 0.6% (12/1862), 40-49 for 0.3% (5/1862), and ≥ 50 for 0.3% (6/1862) of the total confirmed cases. Environmental settings of contacts were available for 1418 confirmed cases. These 1418 confirmed cases had contacts in 1584 environmental settings, which led to the identification of 4675 contacts. Environmental settings were unknown (not available) for the remaining 1453 contacts. A total of 166 confirmed cases had contacts in two different environmental settings, whereas others had contacts in only one setting. The largest number of contacts were identified in households (n=3,150), followed by workplaces (n=589), hospitals (n=544), schools (n=177), malls and markets (n=144), police stations (n=49), churches (n=19), and funerals (n=3).
Telephone survey for confirmed cases of COVID-19: among 1862 confirmed cases identified in Lusaka, Zambia between March 18 and October 31, 2020, phone numbers were available for 1044 cases (56.1%, 1044/1862). These cases were contacted for eligibility for the telephone survey, among which 495 cases (47.4%, 495/1044) participated in the survey (Figure 1). Among 495 cases that participated in the telephone survey, the most common highest education level attained was higher education (73.3%, 363/495) (Table 1). Underlying medical conditions were reported for 143 cases, among which hypertension was most common (16.2%, 80/495), followed by diabetes (4.2%, 21/495) and human immunodeficiency virus (HIV) infection (3.6%, 18/495) (Table 1). Ninety-seven cases (19.6%, 97/495) were hospitalized, 10 cases (2.0%, 10/495) were admitted to the ICU, and 10 cases (2.0%, 10/495) were ventilated (Table 1). Five cases (1.0%, 5/495) had fatal outcomes.
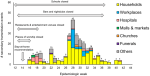
Secondary transmission of COVID-19 in Lusaka: among 1862 confirmed cases of COVID-19, secondary transmission was generated by 272 primary cases (14.6%, 272/1862). A total of 422 secondary cases were generated, and the number of secondary cases per primary case was 1 for 195 primary cases (71.7%, 195/272), 2-4 for 69 cases (25.4%, 69/272), and ≥ 5 for 8 cases (2.9%, 8/272). Secondary attack rates for overall events was 6.1% (95%CI 5.1-7.1) (Table 2). Environmental settings of secondary transmission were available for 215 primary cases, from which secondary cases were generated in 216 settings. Households were the most common environmental setting for secondary transmission, representing 76.4% (165/216). Secondary attack rates was 6.9% (95%CI 5.6-8.1) for secondary transmission events in households, and 6.8% (95%CI 2.4-8.5) in schools, both of which were higher than SAR for overall events (Table 2). Secondary attack rates were highest in funerals (33.3%, 95%CI 0.8-90.6) and churches (10.5%, 95%CI 1.3-33.1), although there was only 1 secondary transmission event in each of these settings and the numbers of contacts were small (3 and 19, respectively). Secondary attack rates was lowest in police stations with 2.0% (95%CI 0.1-10.9), followed by 2.1% (95%CI 0.4-6.0) in malls and markets and 4.6% (95%CI 5.1-7.0) in hospitals (Table 2). Among 8 primary cases that generated ≥ 5 secondary cases, environmental settings for transmission were available for 3. These 3 transmission events took place in households (1 primary case and 7 secondary cases), workplaces (1 primary case and 7 secondary cases), and schools (1 primary case and 8 secondary cases). After the first identification of cases in Zambia on March 18 (epidemiologic week 12), increased numbers of secondary cases were generated in hospitals between weeks 17 and 19 (Figure 2). During the peak of the epidemic between weeks 27 and 33, there were variations in the environmental settings of secondary transmission (e.g., households, hospitals, workplaces, churches) (Figure 2). After week 34, settings of secondary transmission were limited mainly to households (Figure 2).
Factors associated with numbers of contacts and secondary attack rates: among these factors, SAR showed a negative correlation when contacts occurred in malls and markets (OR 0.4, 95%CI 0.1-0.8) (Table 2). None of the factors including demographics, education levels, underlying medical conditions, compliance to mitigation measures, and clinical outcomes, had a statistically significant relationship with SAR (Table 3, Table 4, Table 5).
Geospatial distribution of COVID-19 cases and contacts: among 94 townships in Lusaka, locations, where contacts and secondary transmission occurred, were distributed among 85 townships, including 62 categorized as planned residential areas and 23 categorized as unplanned residential areas (Annex 1 (A, B, C, D). The median numbers of contacts per 105 population in each township were significantly larger in those categorized as planned residential areas than in those categorized as unplanned residential areas (Annex 1 C, Table 6). Similarly, median numbers of secondary cases per 105 population in each township were also significantly larger in those categorized as planned residential areas than in those categorized as unplanned residential areas (Annex 1 D, Table 6). We looked further into the residential areas of 435 confirmed cases (23.4%, 435/1862) for which residential addresses were available. These 435 cases had residents in 61 townships, including 46 planned residential areas and 15 unplanned residential areas (Annex 1 B). Among these 61 townships, median (IQR) numbers of confirmed cases per 105 population were significantly larger in planned residential areas than in unplanned residential areas (Annex 1 B, Table 6).
We reported the characteristics of COVID-19 transmission dynamics and factors associated with SAR in the community during the first wave of the epidemic in Lusaka, Zambia. During the first wave of the epidemic, the majority of secondary transmissions were generated in households. Although the early phase of community transmission was comprised of those in a variety of settings, such as hospitals, schools, malls, and markets, it was contained mainly in households as the epidemic evolved. These changes were assumed to be the results of public health interventions implemented by MoH and ZNPHI, including enhanced infection prevention and control (IPC) measures in hospitals, and mitigation measures imposed for the general population (e.g., stay-at-home, school closures). Our findings were in line with a previous report from the United Kingdom that described a high proportion of hospital transmission in the early phase of community transmission, potentially due to inadequate preparedness in testing capacities, IPC skills, and medical equipment, such as personal protective equipment (PPE), during those periods [25].
Among these environmental settings, SAR in households was higher than that for the overall events, although it did not reach a significant difference. High SAR in households might have been due to multiple factors, including prolonged and frequent contact and reduced compliance to IPC measures (e.g., physical distancing, wearing masks) in those settings. Similar results have been reported from other countries, which is indicative of the difficulties in suppressing COVID-19 transmission in households [26-29]. Funerals have been considered to be a high-risk environmental setting as close physical contacts often occur [30]. Although we observed a high SAR for funerals, the number of contacts were too small to draw any conclusions. Conversely, SAR in environmental settings including hospitals and police stations was smaller than that for the overall events. Strict IPC/mitigation measures applied to those settings might have been effective in reducing the number of transmissions [31,32].
We also reviewed our contact tracing program during the first wave in Lusaka. The contact tracing program was conducted for over 80% of the total confirmed cases identified during the period, which was comparable to or higher than those in HICs during the early phase of epidemics [33]. In the contact tracing program, a larger proportion of contacts and secondary transmissions were reported in planned residential areas than in unplanned residential areas. In addition, the number of confirmed cases involving residents of planned residential areas was larger than those of unplanned residential areas. Based on the assumption that chances of acquiring infections were similar in any geographical area, or even larger in highly populated unplanned residential areas, such differences might have been attributable to reduced health-seeking behaviors and underreporting of COVID-19 cases in unplanned residential areas. Targeted public health interventions specific for individuals in those areas (e.g., enhanced risk communication strategies, active case finding) are required to suppress COVID-19 transmission in Lusaka, Zambia.
In Lusaka, COVID-19 transmission occurred in overdispersion patterns, as only less than 15% of confirmed cases generated secondary transmission [6]. This finding is consistent with previous reports from different parts of the world, which suggests that this is a unique characteristic of COVID-19 transmission irrespective of the geographical region [34]. We could identify a very limited number of SSE, despite the vigorous contact tracing activities that covered over 80% of the total confirmed cases during the period. We cannot rule out the potential effects of the limited testing capacity, contact tracing skills, and registration systems during the first wave. However, it also could have been affected by the design of the contact tracing program. In contrast to the widely adopted contact tracing strategy focusing on individuals who had contact with confirmed cases 48 hours before diagnosis/onset (i.e., “prospective” contact tracing), an alternative strategy called “backward/retrospective” contact tracing, which focuses on individuals who had contact with confirmed cases after 14 days before diagnosis/onset, has been currently adopted in several countries to increase the capacity to identify SSE [35-37]. Such an alternative approach might need to be considered to enhance our capacity to contain COVID-19 transmission due to SSE in Zambia.
Limitations: limitations of our study include the relatively small number of confirmed cases with background information available and potential inclusion bias due to this, reconstruction of pairs of primary and secondary cases based on the date of confirmation, reduced number of confirmed cases in unplanned residential areas, and potential recall bias among participants in the telephone survey. Furthermore, effects of variant strains (e.g., delta variant) and vaccination were not taken into account, as this study was conducted for cases identified before the appearance of the delta variant and vaccine deployment in Zambia. A recent study from the Netherlands reported that COVID-19 vaccination led to an approximately 20% reduction in primary cases generating household transmission [38]. The effects of vaccination on suppressing COVID-19 transmission in households and communities of Lusaka need to be further evaluated.
We reported the characteristics of COVID-19 transmission dynamics and risk factors for high SAR during the first wave in Lusaka, Zambia. Households were the major risk environmental settings for secondary transmission under strict mitigation measures. Continuous efforts are required to establish measures to suppress COVID-19 transmission in those high-risk environments, as well as to better identify SSE and cases in unplanned residential areas in Lusaka, Zambia.
What is known about this topic
- COVID-19 spreads in over-dispersion patterns in the community;
- COVID-19 transmission is likely to occur in environmental settings with the �three Cs (crowded places, close-contact settings, confined and enclosed spaces)� in high-income countries.
What this study adds
- Households were the most common environmental settings for COVID-19 secondary transmission during the �first wave� in Lusaka, Zambia;
- A smaller proportion of contacts and secondary transmissions were reported in unplanned residential areas (i.e., informal settlement areas for low-income residents) than in other areas, potentially due to the reduced health-seeking behaviors and underreporting of COVID-19 cases in those areas.
The authors declare no competing interests.
This work was supported by the Ministry of Health, Zambia, the Japan International Cooperation Agency, and a grant from the National Center for Child Health and Development (2020E-2).
Millica Phiri and Tadatsugu Imamura contributed equally to the manuscript as first authors. They designed the study, collected and analyzed the data, and wrote the manuscript. Patrick Sakubita and Nelia Langa designed the study, analyzed the data, and wrote the manuscript. Nelia Langa designed the study and analyzed the data. Moses Mulenga, Marian Matipa Mulenga, George Kapapi, Michael Mwamba, Jane Nalwimba, Deborah Tembo, Kingsley Keembe, Karen Moompizho, Nkomba Kayeyi, William Ngosa, Davie Simwaba, Paul Msanzya Zulu, Fred Kapaya, Raymond Hamoonga, Mazyanga Lucy Mazaba, Nyambe Sinyange, Muzala Kapina, Nathan Kapata, Victor Mukonka designed the study, collected the data, and revised the manuscript. Chie Nagata and Akira Ishiguro provided critical advice on statistical analysis and interpretation of the results and further revised the manuscript. All the authors have read and agreed to the final manuscript.
We thank the Ministry of Health, Zambia for supporting the contact tracing program and testing for COVID-19 cases in Lusaka, Zambia. We also thank the Ministry of Lands and Natural Resources, Office of the Surveyor General, and National Spatial Data Infrastructure (NSDI) for publishing geospatial data. We also wish to express our gratitude to the senior medical editor at the National Center for Child Health and Development for editing this manuscript.
Table 1: characteristics of primary cases of COVID-19
Table 2: associations between environmental settings and secondary attack rates of COVID-19 cases in Lusaka, Zambia
Table 3: associations between social background and secondary attack rates of COVID-19 cases in Lusaka, Zambia
Table 4: associations between compliance to public health measures and secondary attack rates of COVID-19 cases in Lusaka, Zambia
Table 5: associations between clinical background and secondary attack rates of COVID-19 cases in Lusaka, Zambia
Table 6: distribution of confirmed and secondary cases and contacts in planned and unplanned residential areas in Lusaka, Zambia
Figure 1: study participants
Figure 2: temporal distribution of environmental settings of secondary transmission in Lusaka, Zambia between March 18 and October 31, 2020
Annex 1: geographical distribution of confirmed cases, contacts, and secondary cases of COVID-19 in Lusaka, Zambia between March 18 and October 31, 2020: A) types of residential areas; B) # confirmed cases/105 population; C) # contacts/105 population; D) # secondary cases/105 population (PDF - 109 Kb)
- Zhu N, Zhang D, Wang W, Li X, Yang B, Song J et al. A Novel Coronavirus from Patients with Pneumonia in China, 2019. N Engl J Med. 2020 Feb 20;382(8):727-733. PubMed | Google Scholar
- World Health Organization. Pneumonia of unknown cause China. Assessed 6th May 2022
- World Health Organization. WHO Director-General's opening remarks at the media briefing on COVID-19 - 11 March 2020. Assessed 6th May 2022.
- Chipimo PJ, Barradas DT, Kayeyi N, Zulu PM, Muzala K, Mazaba ML et al. First 100 Persons with COVID-19 Zambia, March 18-April 28, 2020. MMWR Morb Mortal Wkly Rep. 2020 Oct 23;69(42):1547-1548. PubMed | Google Scholar
- World Health Organization. WHO COVID-19 dashboard. Assessed on 6thMay 2022.
- Sneppen K, Nielsen BF, Taylor RJ, Simonsen L. Overdispersion in COVID-19 increases the effectiveness of limiting nonrepetitive contacts for transmission control. Proc Natl Acad Sci USA. 2021 Apr 6;118(14):e2016623118. PubMed | Google Scholar
- Lewis D. Superspreading drives the COVID pandemic and could help to tame it. Nature. 2021 Feb;590(7847):544-546. PubMed | Google Scholar
- World Health Organization. COVID-19. Assessed 6th May 2022.
- Furuse Y, Sando E, Tsuchiya N, Miyahara R, Yasuda I, Ko YK et al. Clusters of Coronavirus Disease in Communities, Japan, January-April 2020. Emerg Infect Dis. 2020 Sep;26(9):2176-2179. PubMed | Google Scholar
- Jang S, Han SH, Rhee JY. Cluster of Coronavirus Disease Associated with Fitness Dance Classes, South Korea. Emerg Infect Dis. 2020 Aug;26(8):1917-1920. PubMed | Google Scholar
- Hamner L, Dubbel P, Capron I, Ross A, Jordan A, Lee J et al. High SARS-CoV-2 Attack Rate Following Exposure at a Choir Practice - Skagit County, Washington, March 2020. MMWR Morb Mortal Wkly Rep. 2020 May 15;69(19):606-610. PubMed | Google Scholar
- World Health Organization. COVID-19 health system response monitor: Japan. Assessed on 6th May 2022.
- British Broadcasting Corporation.Covid: Seoul bans speedy songs in gyms to stop sweating. Assessed on 6th May 2022.
- Centers for Disease Control and Prevention. Considerations for communities of faith. Assessed on 6th May 2022.
- Avadhanula V, Nicholson EG, Ferlic-Stark L, Piedra FA, Blunck BN, Fragoso S et al. Viral Load of Severe Acute Respiratory Syndrome Coronavirus 2 in Adults During the First and Second Wave of Coronavirus Disease 2019 Pandemic in Houston, Texas: The Potential of the Superspreader. J Infect Dis. 2021 May 20;223(9):1528-1537. PubMed | Google Scholar
- Frieden TR, Lee CT. Identifying and Interrupting Superspreading Events-Implications for Control of Severe Acute Respiratory Syndrome Coronavirus 2. Emerg Infect Dis. 2020 Jun;26(6):1059-1066. PubMed | Google Scholar
- Zambia National Public Health Institute. ZAMBIA COVID-19 SITUATION REPORT NO. 356 � EPI WEEK 11. Assessed on 6th May 2022.
- World Health Organization. Intra action review (IAR) of the Zambia COVID-19 outbreak response. Assessed 6th May 2022.
- Ministry of Health Republic of Zambia. Clinical Guidance for Management of Patients with Coronavirus Disease 2019 (COVID-19). Assessed on 6th May 2022.
- Adam DC, Wu P, Wong JY, Lau EHY, Tsang TK, Cauchemez S et al. Clustering and superspreading potential of SARS-CoV-2 infections in Hong Kong. Nat Med. 2020 Nov;26(11):1714-1719. PubMed | Google Scholar
- Imamura T, Saito M, Ko YK, Imamura T, Otani K, Akaba H et al. Roles of Children and Adolescents in COVID-19 Transmission in the Community: A Retrospective Analysis of Nationwide Data in Japan. Front Pediatr. 2021 Aug 10:9:705882. PubMed | Google Scholar
- The World Bank. Upgrading of low income settlement country assessment report Zambia. Assessed on 6th May 2022.
- Sinyange N, Brunkard JM, Kapata N, Mazaba ML, Musonda KG, Hamoonga R et al. Cholera Epidemic-Lusaka, Zambia, October 2017-May 2018. MMWR Morb Mortal Wkly Rep. 2018 May 18;67(19):556-559. PubMed | Google Scholar
- Ministry of Lands and Natural Resources. National Spatial Data Infrastructure. Assessed on 6th May 2022.
- Read JM, Green CA, Harrison EM, Docherty AB, Funk S, Harrison J et al. Hospital-acquired SARS-CoV-2 infection in the UK´s first COVID-19 pandemic wave. Lancet. 2021 Sep 18;398(10305):1037-1038. PubMed | Google Scholar
- Thompson HA, Mousa A, Dighe A, Fu H, Arnedo-Pena A, Barrett P et al. Severe Acute Respiratory Syndrome Coronavirus 2 (SARS-CoV-2) setting-specific transmission rates: a systematic review and meta-analysis. Clin Infect Dis. 2021 Aug 2;73(3):e754-e764. PubMed | Google Scholar
- Cheng HY, Jian SW, Liu DP, Ng TC, Huang WT, Lin HH et al. Contact Tracing Assessment of COVID-19 Transmission Dynamics in Taiwan and Risk at Different Exposure Periods Before and After Symptom Onset. JAMA Intern Med. 2020 Sep 1;180(9):1156-1163. PubMed | Google Scholar
- Bi Q, Wu Y, Mei S, Ye C, Zou X, Zhang Z et al. Epidemiology and transmission of COVID-19 in 391 cases and 1286 of their close contacts in Shenzhen, China: a retrospective cohort study. Lancet Infect Dis. 2020 Aug;20(8):911-919. PubMed | Google Scholar
- Chaw L, Koh WC, Jamaludin SA, Naing L, Alikhan MF, Wong J. Analysis of SARS-CoV-2 Transmission in Different Settings, Brunei. Emerg Infect Dis. 2020 Nov;26(11):2598-2606. PubMed | Google Scholar
- Ghinai I, Woods S, Ritger KA, McPherson TD, Black SR, Sparrow L et al. Community Transmission of SARS-CoV-2 at Two Family Gatherings - Chicago, Illinois, February-March 2020. MMWR Morb Mortal Wkly Rep. 2020 Apr 17;69(15):446-450. PubMed | Google Scholar
- Zambia National Public Health Institute. Press briefing on COVID-19 and additional preventive and control measures. Assessed on 6th May 2022.
- Zambia Police. Lauches standard operating procedure on COVID- 19. Assessed 6th May 2022.
- Lewis D. Why many countries failed at COVID contact-tracing - but some got it right. Nature. 2020 Dec;588(7838):384-387. PubMed | Google Scholar
- Lau MSY, Grenfell B, Thomas M, Bryan M, Nelson K, Lopman B. Characterizing superspreading events and age-specific infectiousness of SARS-CoV-2 transmission in Georgia, USA. Proc Natl Acad Sci USA. 2020 Sep 8;117(36):22430-22435. PubMed | Google Scholar
- Centers for Disease Control and Prevention. Contact tracing resources for health departments : resources for conducting contact tracing to stop the spread of COVID-19. 2020. Assessed 6th May 2022.
- Public Health Ontario. Backward Contact Tracing. Assessed on 6th May, 2022.
- Imamura T, Saito T, Oshitani H. Roles of Public Health Centers and Cluster-Based Approach for COVID-19 Response in Japan. Health Secur. 2021 Mar-Apr;19(2):229-23.. PubMed | Google Scholar
- de Gier B, Andeweg S, Joosten R, Ter Schegget R, Smorenburg N, van de Kassteele et al. Vaccine effectiveness against SARS-CoV-2 transmission and infections among household and other close contacts of confirmed cases, the Netherlands, February to May 2021. Euro Surveill. 2021 Aug;26(31):2100640. PubMed | Google Scholar
Search
This article authors
On Pubmed
- Millica Phiri
- Tadatsugu Imamura
- Patrick Sakubita
- Nelia Langa
- Moses Mulenga
- Marian Matipa Mulenga
- George Kapapi
- Michael Mwamba
- Jane Nalwimba
- Deborah Tembo
- Kingsley Keembe
- Karen Moompizho
- Nkomba Kayeyi
- William Ngosa
- Davie Simwaba
- Paul Msanzya Zulu
- Fred Kapaya
- Raymond Hamoonga
- Mazyanga Lucy Mazaba
- Nyambe Sinyange
- Muzala Kapina
- Chie Nagata
- Nathan Kapata
- Akira Ishiguro
- Victor Mukonka
On Google Scholar
- Millica Phiri
- Tadatsugu Imamura
- Patrick Sakubita
- Nelia Langa
- Moses Mulenga
- Marian Matipa Mulenga
- George Kapapi
- Michael Mwamba
- Jane Nalwimba
- Deborah Tembo
- Kingsley Keembe
- Karen Moompizho
- Nkomba Kayeyi
- William Ngosa
- Davie Simwaba
- Paul Msanzya Zulu
- Fred Kapaya
- Raymond Hamoonga
- Mazyanga Lucy Mazaba
- Nyambe Sinyange
- Muzala Kapina
- Chie Nagata
- Nathan Kapata
- Akira Ishiguro
- Victor Mukonka
Citation [Download]
Navigate this article
Similar articles in
Key words
Tables and figures

Article metrics
Recently from the PAMJ


Authors´ services
