
Spatial drivers of COVID-19 vulnerability in Nigeria
Mayowa Johnson Fasona, Chukwuma John Okolie, Adebayo Akeem Otitoloju
Corresponding author: Chukwuma John Okolie, Department of Surveying and Geoinformatics, Faculty of Engineering, University of Lagos, Lagos, Nigeria 
Received: 28 Aug 2020 - Accepted: 29 Mar 2021 - Published: 07 May 2021
Domain: Community health,Public health,Geography
Keywords: COVID-19, risk factors, vulnerability maps, COVID-19 prediction, geographic information system, Nigeria
©Mayowa Johnson Fasona et al. Pan African Medical Journal (ISSN: 1937-8688). This is an Open Access article distributed under the terms of the Creative Commons Attribution International 4.0 License (https://creativecommons.org/licenses/by/4.0/), which permits unrestricted use, distribution, and reproduction in any medium, provided the original work is properly cited.
Cite this article: Mayowa Johnson Fasona et al. Spatial drivers of COVID-19 vulnerability in Nigeria. Pan African Medical Journal. 2021;39:19. [doi: 10.11604/pamj.2021.39.19.25791]
Available online at: https://www.panafrican-med-journal.com//content/article/39/19/full
Research 

Spatial drivers of COVID-19 vulnerability in Nigeria
Spatial drivers of COVID-19 vulnerability in Nigeria
Mayowa Johnson Fasona1, Chukwuma John Okolie2,&, Adebayo Akeem Otitoloju3
&Corresponding author
Introduction: the spread and diffusion of COVID-19 undoubtedly shows strong spatial connotations and alignment with the physical indices of civilization and globalization. Several spatial risk factors have possible influence on its dispersal trajectory. Understanding their influence is critical for mobilization, sensitization and managing non-pharmaceutical interventions at the appropriate spatial-administrative units.
Methods: on 01 April 2020, we constructed a rapid spatial diagnostics and generated vulnerability map for COVID-19 infection spread at state level using 12 core spatial drivers. The risk factors used include established COVID-19 cases (as at 01 April 2020), population, proximity to the airports, inter-state road traffic, intra-state road traffic, intra city traffic, international road traffic, possible influx of elites from abroad, preponderance of high risk political elite, likelihood of religious gathering, likelihood of other social gatherings, and proximity to existing COVID-19 test centers. These were also tested as predictors of COVID-19 spread using multiple regression analysis.
Results: the results show that 6 States - Lagos, Kano, Katsina, Kaduna, Oyo and Rivers - and the Federal Capital Territory have very high vulnerability, 17 states have high vulnerability and 13 states have medium vulnerability to COVID-19 transmission. Several drivers show a strong association with COVID-19 with the coefficient of correlation ranging from 0.983 - 0.995. The regression analysis indicates that between 96.6 and 99.0 percent of the total variation in the COVID-19 infections across Nigeria can be explained by the predictors.
Conclusion: the spatial pattern of infection across the states are substantially consistent with the predicted pattern of vulnerability.

The dispersal of the new corona virus disease (COVID-19) around the world has shown some interesting patterns. Since the virus was first reported in the Wuhan megalopolis in Hubei Province of China in December 2019, it has dispersed around the world at a speed that is consistent with the speed at which humans also move from place to place, creating a trail of mortality. The geographic pattern of COVID-19 traffic suggests that COVID-19 dispersal around the globe expectedly correlates with the physical indices of civilization and globalization including: the global nighttime views of city lights, global pattern of urbanization, global internet users, and most importantly, the global airline traffic. The spread and diffusion of COVID-19 is dynamic and undoubtedly shows strong spatial connotations. For example, Sarfo and Karuppannan [1] identified an apparent link in COVID-19 infection trends and the regional level of Ghana's population distribution. Historically, disease mapping has been viewed as a relevant issue in public health, derived from an understanding of the underlying relationship between location and health [2-5]. Spatial mapping of diseases could provide insights into puzzles on disease outbreaks and connection between the location and diffusion of diseases [6]. New techniques in geography and allied fields have taken advantage of advances in geospatial technologies including geographic information system (GIS), remote sensing, global positioning system (GPS), and digital cartography for integrating geographic locations with time-dependent observations [7,8]. GIS is increasingly being employed in the analysis of spatial aspects of diseases, including the relationships between pathological factors and their environments, and management and analysis of disease information [6,9].
Several works have applied geospatial analysis and GIS for mapping disease distribution, prevalence and surveillance. These range from online disease mapping for infectious disease studies [6] to diseases prioritization from a public health and cartographic perspective [10]. Geographic information system and mapping has been severally deployed in surveillance analysis of diarrheal disease [11], filariasis [12], schistosomiasis [13,14], malaria [15-18], diabetes, asthma, and hypertension [5], Ebola [19,20], tuberculosis [21-24], and COVID-19 [25]. According to Franch-Pardo et al. [25], GIS and spatial analysis applications to COVID-19 include spatiotemporal analysis, health and social geography, environmental variables, data mining and web-based mapping. Geographic information system application underscores the importance of spatio-temporal elements for COVID-19 mitigation, decision making, planning and community action. Understanding the risks and vulnerabilities to diseases prevalence requires interdisciplinary thinking that considers several socio-environmental drivers including: population, transportation, existing health and social infrastructure, level of economic development and poverty profiles, social behaviour (including customs and traditions), climate, urbanisation, food security, migration, conflict, and globalisation, among others [26]. The "One World, One Health" concept [26-28] reflects the socio-environmental-disease linkage. Disease risk and vulnerability mapping are vital for geographical profiling and relationship to potential risk factors [2,5,29-31]. Africa is expected to be the most vulnerable to COVID-19 based on existing vulnerabilities including poverty and harsh socio-economic conditions and poor governance [32]. However, COVID-19 has so far proved to be a new vulnerability that has little regard for existing resilience structures [33]. Gilbert et al. [34] included Nigeria in the list of countries with the highest COVID-19 importation risk with a large population potentially exposed to COVID-19 infection risk. Nigeria was also listed as part of the 13 top priority countries identified by the World Health Organisation (WHO) on the basis of the volume of travel and direct links to China [34,35]. In Nigeria, the COVID-19 index case announced on 27th February 2020 was a 44-year old Italian citizen who arrived the Murtala Muhammed International Airport, Lagos, on 24th February 2020 aboard Turkish airline from Milan, Italy [36]. Since then, the disease has spread to other parts of the country moving from an imported and elitist pattern to community transmission [37].
Deriving from the global dispersal pattern, the transmission pathways of COVID-19 in Nigeria can be modeled from global (i.e. other continents to Africa through air and sea traffic), continental (from African countries to Nigeria through air and sea traffic), regional (from West Africa sub-region to Nigeria through air, sea, and road traffic), national (interstate movement in Nigeria through air, road, rail and water traffic), states (intra-states and inter LGAs through road, rail and inland water traffic), Local Government Areas (LGAs) and cities (intra LGAs and intra-cities/intra-towns traffic through roads, and inland water in some locations), and community or neighborhood (neighbor-to-neighbor transmission through road and person-to-person). Maritime, rail and road travels were reported as the most important pathways for the transmission of the 1918-1919 influenza pandemic that killed about 500,000 Nigerians [38]. More disease and death resulting from the pandemic was also reported in the urban areas compared to rural areas [38]. It is very likely this pattern would also hold for COVID-19. However, most of the mapping efforts by researchers in Nigeria have been directed at analysis and cartographic representation of the spatial distribution of the disease across the states. There is little evidence of research integrating social and environmental dynamics for mapping, analysis and prediction of the risks or exposure and to construct possible geographic pathways of spread of COVID-19 within Nigeria. The index case for COVID-19 in Nigeria was announced on 27 February 2020. There were 131 COVID-19 infection cases across 12 States and the Federal Capital Territory (Abuja) as at 30 March 2020 when Nigeria began a lockdown. Between 1st and 5th April 2020, we examined some possible geographic pathways of COVID-19 spread and constructed a rapid spatial diagnostics and generated a COVID-19 vulnerability map for Nigeria at State level. Cumulative COVID-19 infection records declared daily by the Nigeria Center for Disease Control (NCDC) are plotted on the Vulnerability map to see the pattern and level of agreement. This paper discusses the constructed vulnerability map and the extent to which the drivers explain COVID-19 infection pattern across Nigeria.

Study area: Nigeria is located in West Africa with an area of about 923,769 km2 roughly defined by Latitudes 4° to 14° North and Longitudes 2°45´ to 14° East. It shares land borders with Benin Republic in the West, Cameroon Republic in the East, Niger Republic in the North and Chad Republic in the North East. It is also bordered by the Atlantic Ocean in the South. Nigeria is Africa´s largest economy with a population of about 201 million [39] and average density of 216.6 persons per square kilometer. The GDP per capita is about 2,320 [40]. Nigeria is also West Africa´s economic power house and major commerce and business destination. Despite the low per capita GDP, the large market attracts migrant influx from across the West Africa sub-region and from across Africa. With five major international airports, Nigeria is well opened to the rest of the World. In particular, the traffic between Nigeria and China, USA, Europe and the Middle East is very high due to heavy dependence on imports of capital and consumer goods from these countries and regions.
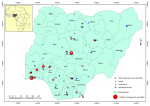
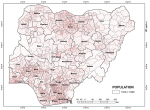
Nigeria is divided into 36 states and a Federal Capital Territory (FCT) (Figure 1). The states are divided into Local Government Areas (LGAs) with 774 LGAs across the nation; and the LGAs divided into electoral wards. Within Nigeria, the highest population clusters are: the South-West corridor, with the epicenter around Lagos and stretching to Ekiti, Ilorin, and Lokoja axis; the Mid-West and South-Eastern areas stretching from Benin City to Enugu, Port-Harcourt and Calabar axis; the Central North with epicenter around Kano and stretching to Katsina, Zaria-Kaduna, Dutse and Hadejia axis; the less expansive areas around the Sokoto-Birni Kebbi axis; the emerging conurbation around the Abuja-Jos axis in Central Nigeria; and the state capitals (Figure 2). Internally, Nigeria is well connected mainly by air and road networks. Rail transport is currently undergoing revitalization and has not commanded the heavy traffic as it used to in the 1970s and 1980s. Commercial water transportation is limited to the interior riverine areas and riparian communities along the major rivers.
Nigeria is a rapidly urbanizing country with urban population standing at about 50.3% in 2018 [41]. Lagos is a primate city and Nigeria's only megacity with an estimated population of about 14 million in 2020 and projected to reach 21 million in 2030 [41]. Lagos is the most important economic, commercial, social and cultural center of the country, and also the major international gateway to Nigeria. With a more developed infrastructure compared to other cities in Nigeria, the traffic from Lagos to other urban areas is very high. It is not surprising that about 34% of COVID-19 cases in Nigeria have been recorded in Lagos. Every urban dweller in Nigeria has kinsmen or family in the rural area. This generates increased internal traffic between the rural and urban areas. Generally, the north-south and west-east traffic by road between the cities and urban spaces are very heavy for economic, trade, political, social, and religious reasons. This presents a formidable risk factor for COVID-19 diffusion around the country.
COVID-19 vulnerability and spatial diffusion drivers: vulnerability is a condition of a person or group and their situation determined by physical, social, economic, environmental, cultural and institutional conditions or processes that increase their susceptibility and influence their capacity to anticipate, cope with, resist and recover from the impact of a hazard [42-45]. Vulnerability assessment is carried out to recognize, measure, understand and predict risk as information basis for mitigation and prevention strategies [43]. Effective preparedness based on data and information has the propensity to reduce exposure and susceptibility which reduces vulnerability and overall impacts. Vulnerability embodies the hazard risk elements and their thresholds/magnitude and human capacity (or lack of capacity) to respond across space. Vulnerability assessment is critical for understanding patterns of exposure to risk, assets and resources available to respond to risk, and critical areas (hotspots) across spaces that require priority or discretional attention. It is also important for deciphering where situations are likely to result into emergencies and for prioritizing emergency response and resource allocations, including place-based and context specific interventions to reduce risk exposure and impacts, and for providing critical information to the people affected.
Generally, some key issues important to assessing vulnerability include: defining the purpose of the assessment (e.g. disease pandemic such as COVID-19, disaster management, climate change etc.), the associated drivers/indicators to be used, how to represent complexity and integrate qualitative and quantitative data, and the granularity or spatial scale at which data will be collected and analyzed (e.g. community, district, local government, or state levels). The COVID-19 pandemic belongs to the class of risk with largely uncertain probability of occurrence and well-defined maximum damage potential [46]. Its uncertain probability of occurrence leaves little time for preparedness, while the clear damage potential makes the pandemic to overwhelm even the most advanced economies with resources, systems and institutions for preparedness and response. Hence, a rapid vulnerability assessment, using available physical, social, economic, health, demographic and institutional data, to understand the spread pattern and possible diffusion trajectory may help to understand the pathways for intensifying non-pharmaceutical interventions.
While the virologists and biomedical scientists are turning to their sequencing machines to try and track the genomes of COVID-19 and understand the strains of the virus circling around the globe, it is also pertinent to look at the different possible geographic pathways of spread of COVID-19 within Nigeria. This is also important from the preventive and disaster-preparedness viewpoint. It is critical for managing mitigation and non-pharmaceutical interventions at the appropriate spatial-administrative units. Several physical, social, economic, health, and organization/governance drivers have possible influence on the transmission and trajectory of COVID-19 dispersal. However, availability of data on many of these at a fine spatial scale remains a challenge. After the index case was announced on 27th February and Nigeria began a lockdown on 30th March, between 1st and 5th April we examined some possible geographic pathways of COVID-19 spread and constructed a rapid spatial diagnostics and generated a COVID-19 vulnerability map for Nigeria at state level.
Due to time and data constraints, 12 core drivers were parameterized for this exploratory study. These are: 1. Established COVID-19 cases (as at 1st April 2020); 2. Population; 3. Proximity to the airports; 4. Inter-state road traffic; 5. Intra-state road traffic; 6. Intra city and community road traffic; 7. International road traffic; 8. Possible influx of elites from abroad (imported cases); 9. Preponderance of political elite (imported cases); 10. Likelihood of religious gatherings; 11. Likelihood of other social gatherings (markets, weddings, funerals, etc.); 12. Proximity to existing COVID-19 test centers (as at 1st April 2020). Some of these factors (especially on transportation) are consistent with those identified as being responsible for the diffusion of the 1918-1919 influenza pandemic [38]. Other factors are related to undermining physical (social) distancing which can exacerbate community transmission of COVID-19.
Assumptions and parameterization: several assumptions were made which led to the parameterization of the drivers in a GIS environment. The assumptions are as follows: 1. Established COVID-19 cases (as at 1st April 2020): states with COVID-19 confirmed cases and states that share boundary with infected states are more predisposed to COVID-19 spread; 2. Population: states with higher population are more vulnerable to the spread of COVID-19 within their borders; 3. Proximity to airports: states with commercial airports (both local and international) are at higher risk of COVID-19 spread from both outside and within Nigeria; 4. Main roads: states that are traversed by major arteries (express roads and highways) have higher risk of COVID-19 spread through movement of high risk population; 5. Road traffic from outside Nigeria: states with major international gateway arteries are more predisposed to infection coming from regional countries (West Africa); 6. Abroad elite influx: imported cases by travelling elites was significant at the onset of COVID-19. Federal and state capitals and states with large urban areas are more likely to experience infection carried from travelling elite from outside the country; 7. Political elite preponderance: a significant number of early COVID-19 infections were from travelling politicians. Federal and State Capitals and states with large urban areas are likely to experience infection brought by travelling politicians; 8. Religious gathering: Nigeria is a highly religious society with many worship centers and the large number of worshippers can lead to difficulties with adhering to physical distancing guidelines. There is higher possibility of large religious gatherings in states with larger population and urban areas; 9. Other social gatherings: Nigerians have high propensity to attend social gatherings including open markets, marriages, burials/funerals, naming ceremonies, etc. in large numbers. Higher possibility of large social gatherings is likely in states with large population and urban areas; 10. Proximity to NCDC test centers (as at 1st April 2020): states with NCDC COVID-19 Test Laboratories and states close to them are more likely to receive rapid attention than those far away. The spatial data including spatial-administrative units, population density, location of airports, road networks, etc. were integrated and the parameterization and analysis implemented within ArcGIS 10.3.1 as shown in Table 1. The total obtainable mark is 122. The scores obtained by the states were classified into four categories: 50 and below (low vulnerability), 51-68 (medium vulnerability), 69-85 (high vulnerability); and 86 and above (very high vulnerability).
Validation: the resulting database from the parameterization are updated with daily cumulative COVID-19 infection data as reported by the NCDC. The cumulative daily cases are plotted on the generated vulnerability map to examine the extent to which the pattern of infection across the states agrees with the vulnerability map. In addition, the database was uploaded from ArcGIS to IBM SPSS Statistics 20 software. Multiple regression analysis was run to determine the extent to which the parameterized drivers help to explain the pattern of recorded COVID-19 infections across the states as at 5th April (when the vulnerability map was constructed), 27th April (2 months after the index case), 27th May (3 months after the index case), 27th June (4 months after the index case) and 27th July (5 months after the index case).
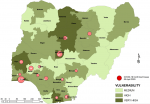
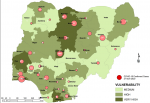
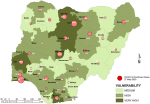
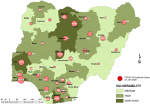
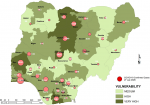
Vulnerability maps and COVID-19 cases: Lagos State has the highest score of 122 marks. This was followed by Kano State with 104 and FCT Abuja with 102 marks. In all, based on the 12 spatial risk drivers used in the analysis, six states - Lagos, Kano, Katsina, Kaduna, Oyo and Rivers - plus the Federal Capital Territory (FCT) have very high vulnerability to COVID-19 spread. Seventeen (17) states have high vulnerability and 13 states have medium vulnerability to COVID-19 spread in Nigeria as shown in Table 2. Figure 3, Figure 4, Figure 5, Figure 6, Figure 7 show the vulnerability maps and pattern of cumulative COVID-19 infection records across the states for 5th April (when the vulnerability map was constructed), 27th April (2 months after the index case), 27th May (3 months after the index case), 27th June (4 months after the index case) and 27th July (5 months after the index case). The cumulative COVID-19 recorded infection across Nigeria increased from 232 cases (spread across 14 states and the FCT) on 5th April when the vulnerability map was constructed to 1,337 cases (in 33 states and the FCT) on 27th April, two months after the index case; 8,733 (in 35 states and the FCT) on 27th May, three months after the index case; 24,077 (in 35 states and the FCT) on 27th June, four months after the index case; and 41,180 (in all Nigeria´s 36 states and the FCT) on 27th July, 5 months after the index case. The spatial pattern of infection across the states are substantially consistent with the predicted pattern of vulnerability with Lagos, FCT and Kano leading in the number of infection cases in the first two months after the index case. However, with community transmission taking over, states around Lagos including Oyo, Ogun, Ondo, as well as Edo, Delta, Rivers in the southern region have recorded strong increase in number of cases. Kaduna, Plateau and Katsina also recorded a significantly high increase. Incidentally, all these states were categorized as either very high or high in the vulnerability map. A few outliers were also observed including Ebonyi and Gombe states which recorded a strong increase in the number of cases contrary to expectations. States like Sokoto and Niger in the Northwestern axis as well as Anambra and Imo in the eastern axis did not register as much COVID-19 infections as expected.
Performance of risk factors: in order to estimate the extent to which the selected drivers captured COVID-19 infection at state level across Nigeria, multiple regression analysis was run with the 12 predictors. However, three variables: scor_Exp (expressway traffic), Pol_ELT (political elite) and Rel_Gath (religious gathering) were automatically excluded for multicollinearity. Table 3 shows the multiple regression analysis of the selected predictors with recorded cumulative COVID-19 infection cases as at 5th April, 27th April, 27th May, 27th June and 27th July. For all the dependent variables (i.e. cumulative COVID-19 cases for the dates shown), the R values range from 0.983 to 0.995 which indicate a good level of prediction. The coefficient of determination (R2) values suggest that between 96.6 and 99.0 percent of the total variation in the COVID-19 infections across Nigeria can be explained by the predictors. The ANOVA outputs also suggest that these variables have statistically significant effects on the recorded COVID-19 cases across Nigeria.
When the Federal Government of Nigeria implemented the lockdown on 30th March 2020 as part of the measures to curtail the spread of the COVID-19, international airports were closed to eliminate imported cases from global, continental and regional transmissions. But in addition to considerations for special flights, the land borders remained open for Nigerians from other West African countries to enter the country. For example, the early COVID-19 cases in Osun State were imported by returnees from Abidjan, Cote D´Ivoire. The local airports were also closed to cut off interstate dispersal through air traffic. Perhaps, more significantly, total lockdown was imposed on Lagos (the epicenter of COVID-19 cases), and the nearby Ogun State (which shares part of the Lagos conurbation) and the FCT, Abuja. Nigeria entered the phased lockdown on 30th March 2020 with 131 cases spread across 12 states and the FCT and started gradual lifting of total lockdown on Lagos, Ogun and Abuja after 35 days on 4th May 2020 with 2,802 cases spread across 34 states and FCT, Abuja. Even after the ease of lockdown, the restrictions on mass gathering in social and religious places were maintained. These were done to reduce the risk of transmission to other states by road travelers from these high risk areas and prevent community transmission. There is no doubt that the lockdown constrained the spread of COVID-19 infections to an extent. But there were also newspaper reports suggesting that even during the lock down, illegal commercial transportation along the major road arteries thrived.
There is little evidence to show that spatial data and analytical results and outputs from GIS analysis were employed by the governments at any level in Nigeria to aid COVID-19 preparedness and responses. This presents a big setback to COVID-19 responses and mobilization as spatial characterization and risk of places to COVID-19 diffusion at different levels - state, LGA, town/community and neighborhood - were and still largely unknown. The lack of knowledge about COVID-19 risk characterization across states possibly informed the extreme top-down approach to mitigation of COVID-19 responses employed by the government and the very low level of awareness and lack of information and initiative for responsibility and ownership at the LGA and community levels in Nigeria.
This study constructed rapid spatial diagnostics and generated vulnerability maps for COVID-19 infection spread at state level in Nigeria using 12 core spatial drivers that include established COVID-19 cases (as at 1st April 2020), population, proximity to the airports, inter-state road traffic, intra-state road traffic, intra city traffic, international road traffic, possible influx of elites from abroad, preponderance of high risk political elite, likelihood of religious gathering, likelihood of other social gatherings and proximity to existing COVID-19 test centers. These were also tested as predictors of COVID-19 spread. The spatial pattern of infection across the states are substantially consistent with the predicted pattern of vulnerability. Several drivers show a strong association with the coefficient of correlation (R) values ranging from 0.983 - 0.995, and R2 values indicating that 96.6 - 99.0 percent of the total variation in the COVID-19 infections across Nigeria can be explained by the predictors. These results tend to support the general belief that lockdown measures limiting physical interaction are an effective decision against COVID-19. However, lockdown alone without mobilization and sensitization at the different spatial units including state, LGA, towns/villages and neighborhoods will not likely be successful in reducing community transmission. The latter requires robust understanding of the spatial risk and transmission factors and the vulnerability to COVID-19 at LGA and community levels. A robust understanding of the intrinsic differences in actual and expected/predicted community transmission across spatial units will help in resource mobilization, surveillance (including where increased testing is required), risk communication, and use of established community channels for contact tracing and dissemination of information on non-pharmaceutical interventions. These place-based and context-specific measures are critical for successful management of COVID-19 spread in many resource-limited countries around the world.
What is known about this topic
- COVID-19 has so far proved to be a new vulnerability that has little regard for existing resilience structures;
- Understanding the risks and vulnerabilities to COVID-19 prevalence requires interdisciplinary thinking that considers several socio-environmental drivers.
What this study adds
- Spatial drivers including population, transportation, high risk political elite concentration, and likelihood of religious and social gatherings are good predictors of COVID-19 spread in Nigeria with R ranging from 0.983 - 0.995. The R2 values indicates that between 96.6 and 99.0 percent of the total variation in the COVID-19 infections pattern across Nigeria can be explained by the predictors;
- A robust understanding of the intrinsic differences in spatial risk and its impact on community transmission across spatial units is indispensable for resource mobilization, surveillance, risk communication, and use of established community channels for contact tracing and dissemination of information on non-pharmaceutical interventions;
- The poor knowledge about COVID-19 risk characterization across spaces possibly informed the extreme top-down approach to mitigation employed by the government and the very low level of awareness and lack of information and initiative for responsibility and ownership by the population at LGA and community level.
The authors declare no competing interests.
Research conceptualization and design - MJF, AAO; Data collection, analysis and manuscript preparation - MJF, CJO, AAO. All the authors have read and agreed to the final manuscript.
The cumulative COVID-19 records used were sourced from the online portal of the Nigeria Center for Disease Control (NCDC).
Table 1: factor parameterization
Table 2: vulnerability at state level
Table 3: multiple regression analysis of selected risk factors and COVID-19 cases
Figure 1: Nigeria - administrative units, airports and COVID-19 cases at 01 April 2020
Figure 2: Nigeria - population density
Figure 3: vulnerability map and COVID-19 cases 05 April 2020
Figure 4: vulnerability map and COVID-19 cases 27 April 2020
Figure 5: vulnerability map and COVID-19 cases 27 May 2020
Figure 6: vulnerability map and COVID-19 cases 27 June 2020
Figure 7: vulnerability map and COVID-19 cases 27 July 2020
- Sarfo AK, Karuppannan S. Application of geospatial technologies in the COVID-19 fight of Ghana. Trans Indian Natl. Acad. Eng. 2020;5:193-204. Google Scholar
- Bailey TC. Spatial statistical methods in health. Cad Saude Publica. 2001;17(5):1083-1098. PubMed | Google Scholar
- Best N, Richardson S, Thomson A. A comparison of Bayesian spatial models for disease mapping. Stat Methods Med Res. 2005;14(1):35-59. PubMed | Google Scholar
- Coly S, Charras-Garrido M, Abrial D, Yao-Lafourcade AF. Spatiotemporal disease mapping applied to infectious diseases. Procedia Environmental Sciences. 2015;26:32-37. Google Scholar
- Murad A, Khashoggi BF. Using GIS for disease mapping and clustering in Jeddah, Saudi Arabia. ISPRS International Journal of Geo-Information. 2020;9(5):328. Google Scholar
- Gao S, Mioc D, Anton F, Yi X, Coleman DJ. Online GIS services for mapping and sharing disease information. Int J Health Geogr. 2008;7:8. PubMed | Google Scholar
- Richardson D. Transforming science and society, in geographic information science and technology body of knowledge, DiBiase D, DeMers M, Johnson A et al. Eds. Association of American Geographers, Washington, DC, USA. 2006.
- Olanrewaju OE, Adepoju KA. Geospatial assessment of cholera in a rapidly urbanizing environment. Journal of Environmental and Public Health. 2017;2017:6847376. PubMed | Google Scholar
- Cromley EK. GIS and disease. Annual Review of Public Health. 2003;24:7-24. PubMed | Google Scholar
- Pigott DM, Howes RE, Wiebe A, Battle KE, Golding N, Gething PW et al. Prioritising infectious disease mapping. PLoS Negl Trop Dis. 2015;9(6):e0003756. PubMed | Google Scholar
- Kumar VS, Devika S, George S, Jeyaseelan L. Spatial mapping of acute diarrheal disease using GIS and estimation of relative risk using empirical Bayes approach. Clinical epidemiology and global health. 2017;87-96. Google Scholar
- Okorie PN. Application of geographical information system for lymphatic filariasis and malaria control in Nigeria. Afr J Med Med Sci. 2014;43(2):161-166. PubMed | Google Scholar
- Brooker S. Spatial epidemiology of human schistosomiasis in Africa: risk models, transmission dynamics and control. Transactions of the Royal Society of Tropical Medicine and Hygiene. 2007 Jan;101(1):1-8. PubMed | Google Scholar
- Simoongaa C, Utzingerc BJ, Brookerd S, Vounatsouc EP, Appleton CC, Stensgaard AS et al. Remote sensing, geographical information system and spatial analysis for schistosomiasis epidemiology and ecology in Africa. Parasitology. 2009 Nov;136(13):1683-93. PubMed | Google Scholar
- Kirk K, Haq M, Alam M, Haque U. Geospatial technology: a tool to aid in the elimination of Malaria in Bangladesh. ISPRS International Journal of Geo-Information. 2014;4(1):47-58. Google Scholar
- Li Z, Roux E, Dessay N, Girod R, Stefani A, Nacher M, Moiret A et al. Mapping a knowledge-based malaria hazard index related to landscape using remote sensing: application to the cross-border area between French Guiana and Brazil. Remote Sensing. 2016;8(4):319. Google Scholar
- Ferrao J, Niquisse S, Mendes J, Painho M. Mapping and modelling malaria risk areas using climate, socio-demographic and clinical variables in Chimoio, Mozambique. International Journal of Environmental Research and Public Health. 2018;15(4):795. PubMed | Google Scholar
- Quan H, Igbasi U, Oyibo W, Omilabu S, Chen S, Shen H et al. Molecular determinants of sulphadoxine-pyrimethamine resistance from Plasmodium falciparum isolates in Lagos, Nigeria. Infectious Diseases of Poverty Journal. 2020;9:91.
- Nic Lochlainn LM, Gayton I, Theocharopoulos G, Edwards R, Danis K, Kremer R et al. Improving mapping for Ebola response through mobilising a local community with self-owned smartphones: Tonkolili District, Sierra Leone, January 2015. PloS one. 2018;13(1):e018995. PubMed | Google Scholar
- ESRI. Mapping epidemics: from SARS, Zika, and Ebola to the pandemic of COVID-19. 2020. Accessed: August 5, 2020.
- Patterson B, Morrow CD, Kohls D, Deignan C, Ginsburg S, Wood R. Mapping sites of high TB transmission risk: Integrating the shared air and social behaviour of TB cases and adolescents in a South African township. Science of The Total Environment. 2017;583:97-103. PubMed | Google Scholar
- Shaweno D, Karmakar M, Alene KA, Ragonnet R, Clements ACA, Trauer JM et al. Methods used in the spatial analysis of tuberculosis epidemiology: a systematic review. BMC Med. 2018;16(1):193. PubMed | Google Scholar
- Mollalo A, Mao L, Rashidi P, Glass GE. A GIS-based artificial neural network model for spatial distribution of tuberculosis across the continental United States. International Journal of Environmental Research and Public Health. 2019;16(1):157. PubMed | Google Scholar
- Gehlen M, Nicola MRC, Costa ERD, Cabral VK, de Quadros ELL, Chaves CO et al. Geospatial intelligence and health analytics: Its application and utility in a city with high tuberculosis incidence in Brazil. Journal of Infection and Public Health. 2019;12(5):681-689. PubMed | Google Scholar
- Franch-Pardo I, Napoletano BM, Rosete-Verges F, Billa L. Spatial analysis and GIS in the study of COVID-19: a review. Science of the Total Environment. 2020;739:140033. PubMed | Google Scholar
- McMichael AJ, Confalonieri U, Brijnath B. Environment, climate change, social factors and the implications for controlling infectious diseases of poverty. In AMJ Oduola (Ed). Global Report for Research on Infectious Diseases of Poverty. 2012:44-65. Google Scholar
- Gibbs EP, Anderson TC. “One World, one health” and the global challenge of epidemic diseases of viral aetiology. Veterinaria Italiana. 2009;45(1):35-44. PubMed | Google Scholar
- van Helden PD, van Helden LS, Hoal EG. One world, one health. Humans, animals and the environment are inextricably linked--a fact that needs to be remembered and exploited in our modern approach to health. EMBO reports. 2013;14(6):497-501. PubMed | Google Scholar
- Aylin P, Maheswaran R, Wakefield J, Cockings S, Jarup L, Arnold R et al. A national facility for small area disease mapping and rapid initial assessment of apparent disease clusters around a point source: the UK Small Area Health Statistics Unit. Journal of Public Health Medicine. 1999;21(3):289-298. PubMed | Google Scholar
- Leonardo LRBA, Crisostomo JAA, Solon PT, Rivera AB, Marcelo JMV. Geographical information systems in health research and services delivery in the Philippines. Geospatial Health. 2007 May;1(2):147-55. PubMed | Google Scholar
- Yang CA. Comparison of four methods of diseases mapping. Lund University GEM thesis series nr. 2016;13. Google Scholar
- Lone SA, Ahmad A. COVID-19 pandemic - an African perspective. Emerging Microbes and Infections. 2020 Dec;9(1):1300-1308. PubMed | Google Scholar
- Otitoloju AA, Oluwole EO, Bawa-Allah KA, Fasona MJ, Okafor IP, Isanbor C et al. Preliminary evaluation of COVID-19 disease outcomes, test capacities and management approaches among African countries. MedRxiv Preprint. 2020. Google Scholar
- Gilbert M, Pullano G, Pinotti F, Valdano E, Poletto C, Boëlle PY et al. Preparedness and vulnerability of African countries against importations of COVID-19: a modelling study. Lancet. 2020 Mar 14;395(10227):871-877. PubMed | Google Scholar
- WHO Regional Office for Africa. WHO ramps up preparedness for novel coronavirus in the African region. 2020. Accessed August 5, 2020.
- NCDC. Disease situation reports. 2020. Accessed August 5, 2020.
- Amzat J, Aminu K, Kolo VI, Akinyele AA, Ogundairo JA, Danjibo MC. Coronavirus outbreak in Nigeria: burden and socio-medical response during the first 100 days. International Journal of Infectious Diseases. 2020 Sep;98:218-224. PubMed | Google Scholar
- Ohadike DC. Diffusion and physiological responses to the influenza pandemic of 1918-19 in Nigeria. Soc Sci Med. 1991;32(12):1393-1399. PubMed | Google Scholar
- UNFPA. State of the world´s population: unfinished business the pursuit of rights and choices for all. UNFPA, New York. 2019.
- African Development Bank. African Statistical Yearbook. AfDB, Abidjan, Cote d´Ivoire. 2017.
- UNDESA. World Urbanization Prospects: The 2018 Revision. Online Edition. 2018.
- World conference on disaster reduction. Brief history of the WCDR process. 2006. Accessed August 5, 2020.
- Taubenbock H, Roth A, Dech S. Vulnerability assessment using remote sensing: the earthquake prone mega-city of Istanbul, Turkey. Proceeding of the 32nd International symposium on remote sensing (ISRE), June 25th to 29thSan Jose, Costa Rica. 2007. Google Scholar
- IPCC. Managing the risks of extreme events and disasters to advance climate change adaptation. Cambridge, Cambridge University Press. 2012. Google Scholar
- Wisner B, Blaikie P, Cannon T, Davis I. At risk: natural hazards, people´s vulnerability and disasters. Second edition, Routledge. 2014.
- German Advisory Council on Global Change (WBGU). World in transition: strategies for managing global environmental risks, 1998. Springer: Berlin; Heidelberg; New York; Barcelona; Hong Kong; London. 1998.
Search
This article authors
On Pubmed
On Google Scholar
Citation [Download]
Navigate this article
Similar articles in
Key words
Tables and figures

Article metrics
PlumX Metrics
Spatial drivers of COVID-19 vulnerability in NigeriaRecently from the PAMJ


Authors´ services
