
The neuroimaging magnitude of pediatric brain atrophy in northern Tanzania
Richard Erasto Sungura, John Martin Spitsbergen, Emmanuel Abraham Mpolya, Elingarami Sauli, John-Mary Vianney
Corresponding author: Richard Erasto Sungura, Department of Health and Biomedical Sciences, School of Life Science, and Bioengineering, Nelson Mandela-African Institution of Science and Technology, Arusha, Tanzania 
Received: 26 Mar 2020 - Accepted: 04 Apr 2020 - Published: 21 May 2020
Domain: Radiology,Family Medicine,Internal medicine
Keywords: Brain atrophy, brain volume, evans index, neuroimaging
©Richard Erasto Sungura et al. Pan African Medical Journal (ISSN: 1937-8688). This is an Open Access article distributed under the terms of the Creative Commons Attribution International 4.0 License (https://creativecommons.org/licenses/by/4.0/), which permits unrestricted use, distribution, and reproduction in any medium, provided the original work is properly cited.
Cite this article: Richard Erasto Sungura et al. The neuroimaging magnitude of pediatric brain atrophy in northern Tanzania. Pan African Medical Journal. 2020;36:25. [doi: 10.11604/pamj.2020.36.25.22515]
Available online at: https://www.panafrican-med-journal.com//content/article/36/25/full
Research 
The neuroimaging magnitude of pediatric brain atrophy in northern Tanzania
The neuroimaging magnitude of pediatric brain atrophy in northern Tanzania
Richard Erasto Sungura1,&, John Martin Spitsbergen2, Emmanuel Abraham Mpolya1, Elingarami Sauli1, John-Mary Vianney1
1Department of Health and Biomedical Sciences, School of Life Science and Bioengineering, Nelson Mandela-African Institution of Science and Technology, Arusha, Tanzania, 2Department of Biological Sciences, Western Michigan University, Michigan, United State of America
&Corresponding author
Richard Erasto Sungura, Department of Health and Biomedical Sciences, School of Life Science and Bioengineering, Nelson Mandela-African Institution of Science and Technology, Arusha, Tanzania
Introduction: the loss of parenchymal brain volume per normative age comparison is a distinctive feature of brain atrophy. While the condition is the most prevalent to elderly, it has also been observed in pediatric ages. Various causes such as trauma, infection, and malnutrition have been reported to trigger the loss of brain tissues volume. Despite this literature based knowledge of risk factors, the magnitude of brain atrophy in pediatric age group is scantly addressed in most developing countries including Tanzania. The current study aims to understand the magnitude of brain atrophy in children residing in Northern Zone, Tanzania.
Methods: a cross-sectional hospital survey was performed in which 455 children who were presented with various brain pathologies from the year 2013 to 2019 and whose brains examined by Computerized tomography (CT)-Scanners were recruited in the study. The brain statuses were examined using three linear radiological methods including the measure of sulcal-width, Evans index, and lateral ventricular body width.
Results: results showed a significant number of atrophied brains among children in Northern Tanzania and that the condition was observed to have a 1:1 male to female ratio. The prevalence of pediatric brain atrophy was found to be 16.04%.
Conclusion: the cortical subtype of brain atrophy presented as the most prevalent type of brain volume loss. The findings of this study suggest existence of considerable trends of brain atrophy in children which need special attention and mitigation plans.

Brain atrophy being unusual reduction in brain volume than expected in the normal development and involution of brain at a particular age, is an important clinical condition in the current and future perspectives of neuroscience and related disciplines in studying neuro-cognitive functions and anatomical structures of the human brain. When fully developed, the atrophied brain manifests with reduction in parenchymal volume with the corresponding enlargement of sulcal spaces, basal cisterns and ventricles which are occupied by increased cerebrospinal fluid volume as a result of ex-vacuo response [1]. Though the process of brain volume loss is commonly found in elderly, there is a number of evidences on the similar observation in childhood [2].There are also various pathological events that have been closely associated with loss of brain tissues and affect the normal anticipated course of brain tissue proliferation in childhood. Among causes of brain atrophy involve birth asphyxia [3], inborn errors of metabolism [4], trauma [5], infection [6], malnutrition [7], cytotoxic drugs and radiation injuries [8]. In developing countries including Tanzania, the magnitude of brain atrophy in children remains uncertain in most of scientific literatures as not much has been studied and published. Most studies cover the aspects of brain atrophy as part of neurodegenerative changes in elderly such as Alzheimer´s disease, multiple sclerosis, Cerebral autosomal arteriopathy with subcortical infarcts and leukoencephalopathy (CADASIL) syndrome [9] and other white matter changes [10]. Prevalence of brain atrophy therefore has been frequently covered as an entity among other disease conditions such as liver cirrhosis [11] and alcoholism [12]. Such conditions are rare in childhood, therefore makes brain atrophy to be more construed as a disease of old age [13]. In Tanzania brain atrophy in childhood is becoming a common condition in neuro-imaging settings. However, no study has addressed this condition in childhood and hence its prevalence in the country remains unknown. Studies have shown that, to a significant extent pediatric brain atrophy is associated with central nervous system infection such as malaria and HIV-encephalopathy [6], trauma and birth related brain injury to mention a few [14]. These pathological processes are also common in the country, thus why the current study seeks to understand the status quo of the brain atrophy in children by determining its prevalence so as to set baseline information for the magnitude of brain atrophy and its burden in Tanzania, specifically Northern Zone of the country.

Subjects and image acquisition: we studied 455 young patients who were presented in radiology departments of health facilities in the Northern Tanzania and performed brain CT scan examinations between the years 2013 to 2019. All patients underwent CT scan brain using primary axial cuts with slice thickness of 5mm and increment of 2mm. All the images were taken along the standard radiological baseline.
CT scan image analysis: brain CT scan images were examined using the three known radiological linear methods to determine the presence or absence of brain atrophy. The similar measurements were used to differentiate the subtypes of brain atrophy including global atrophy, central atrophy, cortical atrophy, focal atrophy and hemi-atrophy. While the Evans index (EI) and lateral ventricle body width (VW) measure the central type of brain atrophy [15], the cortical sulcal width (SW) measure the cortical or peripheral type of brain atrophy [16]. The atrophy in one lobe or part of a lobe it is categorized as focal brain atrophy [17] and a loss of volume in one and whole hemisphere is referred as brain hemi-atrophy [18]. Global atrophy involves both cortical and central atrophy bilaterally resulting into delocalized or whole brain volume reduction in a symmetrical fashion [19].
Statistical analysis: data were analyzed by R-statistical package where mean and p-values for age and gender association, and brain ventricular size and sulcal width were obtained. The percentage of subjects with brain atrophy or normal brain was calculated.
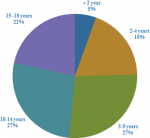
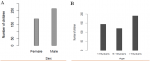
Demography: the demographic characteristics showed that the predominant population involved children above 10 years of age, while the under five constituted a relatively lower population (Figure 1, Figure 2A). In this study males were 264 while females were 191 equals to 58% and 42% respectively, indicating that the male children who attended hospitals for CT scans were more than female children. Therefore, the mean age of all participants was 9.25 (±5.24) years (Figure 2B).
Comparison of radiological measurements: the quantitative evaluation of children brains using the three linear radiological measurements showed that sulcal width (SW) and lateral ventricular width (VW) had P-value <0.05 suggesting significant association with age while the Evans Index (EI) had P-value of 0.431 indicating less significant age association (Table 1). When gender association was considered, the three radiological linear measurements for all THREE measurements SW, VW and EI had insignificant gender association with p-vale greater than 0.05 (Table 1). The SW and EI have shown variation presented by high standard deviation in both males and females (data not shown).
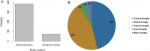
The status of brains volume: in the total of 455 children who were reviewed, 73 children equals 16.04% presented with brain volume reduction, that is brain atrophy (Figure 3A). The remaining 382 equals to 83.96% children showed normal brain volume or had other brain pathologies not related to brain volume loss.
The patterns of brain volume loss: of the Brain atrophy cases presented, about five patterns of brain atrophy were observed. These included cortical atrophy, global atrophy, central, focal and hemiatrophy with the percentage of 46%, 43%, 4%, 4% and 3% respectively (Figure 3B). Some varying patterns of typical brain volume loss are shown as they appear on CT scan images (Figure 4). Further scrutiny of atrophic cases showed the variegated trends in levels of vulnerability whereas children below 5 years of age were the most vulnerable compared to children above 10 years of age (data not shown).
The purpose of this study was to determine the magnitude of brain atrophy as seen among children in Northern Tanzania. In this study, we show that the brain atrophy occurs mostly in children less than five years old compared to children of higher age groups in the population. The under-five children are likely to be affected more than the older children by this condition in connection to their immature respiratory and immune system resulting into higher propensity to both central nervous system and respiratory tract infection [20], the conditions that may results into brain cells damage [21]. The children above-five show low vulnerability with age advancement due to a possibility that brain atrophy to a large extent is incompatible with life in childhood hence atrophied brain could not be carried forward to late childhood and adolescence due to mortality as per the study by Kulak et al., 2003 [22] who demonstrated that brain atrophy was a poor prognostic indicator for children with epilepsy. Further studies suggest that the degree of brain tissues damage is directly related to poor functional recovery [23]. Therefore, mortality is a considerable explanation for low trend of brain atrophy in late childhood.
Gender distribution of brain atrophy for the population who participated in the current study seem to be equal for both male and female children, this implies insignificant correlation of brain atrophy with gender. This observation is possibly due to overall equal propensity to the risk factors of brain atrophy during childhood compared to adolescence and adulthood in which traumatic brain injury is a common risk factor with higher male to female ratio [24]; furthermore, the hormonal mediated secondary sexual characteristic at studied age range has insignificant impact on brain differentiation influenced by gonadal hormones. The gonadal hormones namely estrogen, progesterone and testosterone [25], have influence on brain development but more importantly estrogen has shown neuro-protective role in adult females as evidenced by rapid brain atrophy and demyelination in post menopausal period after estrogen withdrawal [26]. The estrogen role is thought to be mediated by an interaction with insulin like growth factor (lGF-1) [27]. Progesterone has concurrently been reported to facilitate repair of brain cells after traumatic brain injury [28]. In a nutshell, gonadal hormones´ significance in brain growth and maintenance exists in varied mechanisms. The Evans index(EI) insignificant correlation in pediatric brain atrophy, can be explained by the fact that Evans index nominator is measured through the frontal horns of the ventricle while myelination (maturation of white matter) is known to start from occipital toward frontal lobes during childhood and hence less change in Evans index values is anticipated [29]. Therefore, the use of multi-parametric assessment of brain volume improves depiction power of brain atrophy in varying ages. The variations involving sulcal width and Evans index with high standard deviations can be due to presence of transitional states that affect structural shape of skull and brain volume. For instance, hospitalized patients and especially children if are over hydrated with I.V fluids they tend to have temporary increase in body fluids [30] and when dehydrated after conditions like diarrheal diseases children tend to have reduced intracranial fluid, overlapping sutures and sunken fontanels hence resulting into variation in the measured dimensions irrespective of similarities in age factor [31]. The similar condition might have happened in the current study, although, these parameters were beyond the scope of this study. The cortical type of brain atrophy was more prevalent type of brain atrophy followed by the global brain atrophy. This observation could be accounted by the possibility that the determinants of brain atrophy in these two categories are likely to be the results of systemic pathological processes like drug mediated brain injury and malnutrition such as marasmic-kwashiorkor [32]; the vast majority of systemic conditions are likely to cause generalized and symmetrical cerebral volume loss with surprisingly no significant change in brain stem and cerebellum. Furthermore, the cortical atrophy is mostly the outcome of volume loss in grey-matter than the white matter [33]. Under normal circumstances studies have shown evidence of more brain perfusion in grey-matter than white matter to meet metabolic demands, hence this is in alignment with the findings of this study that systemic determinants of brain atrophy tend to have predilection to the brain tissues with high metabolic demand normally, these brain parts are characterized by high calculated perfusion values just as the way grey matter shows higher average enhancement value than white matter in CT perfusion study [34]. Therefore, the patterns of brain atrophy may reflect the nature of the brain injury determinants. Hemi-atrophy seems to be rare according to this study and likewise in the overall global statistics [35]. The reason for this could be explained by the high possibility that the determinants of brain hemi-atrophy are more responsible for the condition during intra-uterine life than post natal life [36]. From the light of literature, among other reasons for brain hemi-atrophy is an ischemic event or vascular occlusion during pre-natal period that results into lateralized or localized brain hemispheric volume loss with sparing of the other hemisphere and hence asymmetrical brain development [37]. From this back ground, asymmetrical skull shapes are common findings in children with brain hemi-atrophy.
Meanwhile, the central brain atrophy can be a result of a previous pathological condition. In the current study population, the central brain atrophy seems to be the result from a previous hydrocephalus with white matter change due to seepage of cerebro-spinal fluid before treatment intervention by ventriculo-peritoneal shunt is instituted [38], whereas in different population, multiple sclerosis was reported to be involved in causing a central brain atrophy [23], suggesting that the means of prevention, diagnosis, and treatment of central brain atrophy may be diverse. In this and other studies, cases of white matter demyelinative disease are rare in childhood compared to adult; hence purely central type of brain atrophy is not a prevalent form of volume loss compared to cortical and global atrophy. While the brain atrophy is construed as a common condition in elderly [39], this study has presented a 16.4% of brain atrophy prevalence in children contrary to the only available local data from the study by Muola D, 2017 accessed through the Muhimbili University of Health and Allied Sciences´ repository in Tanzania. In this local study, brain atrophy prevalence of about 13% was reported among adult patients with white matter diseases [40]. Other studies suggest a very close relation between brain atrophy and white matter diseases in senile age [41]. The brain atrophy prevalence of 13% in adults is equivocal for the age and is not in tandem with the concurrent presence of white matter diseases; such a finding is likely to have been eluded by technical issues related to lack of reproducible quantitative tools for measuring and diagnosing brain atrophy [42]. The study done in Ibadan West Africa presented the brain atrophy prevalence of 10.6% in children [43], which is close to the results of our study by virtual of age correlation. Therefore age related studies focusing on the quantitative neuro-investigations are the way to address the true burden of brain atrophy in children and other age groups as brain volumes varies significantly with age [44]. Most adults in fifth decade of life have brain atrophy of senility hence they cannot be regarded in the same manner as children [45]. Higher magnitude of brain atrophy is anticipated and may be accelerated by other pathologies such as diabetes [46], stroke, alcoholic encephalopathy and liver cirrhosis among other conditions which are seldom in childhood [47]. Even though, multiple co-morbidities explain why brain atrophy appears to be the disease of elderly, more cases detection can be achieved with the optimal use of quantitative techniques in children neuro-imaging.
Vulnerability levels seem to be closely associated with age such that the under-five years were more affected by brain atrophy compared with children between 4 and 10 years of age. The children above 10 years were least affected by this condition. This could be due to more risk factors such as low immunity to infection, incidence of trauma [23] and birth related injuries at this early age [48]. A study by Zimmern et al. (1979) showed various brain areas of infarcts in some children who were abused, all those children in the study developed brain atrophy [49], Similarly, Pinto et al. (2012) showed the plasticity of pediatric skull contributes to specific patterns of injuries of young children brains [50] and therefore, the degree of the brain trophy depends on the severity of the brain injury [51]. Life incompatibility with brain atrophy remains to be among concrete reasons why the prevalence of the pathology is less above five years old as most children with severe brain atrophy or injury might have not proceeded further to early adolescence with irreversible forms of this condition [52]. Therefore, an orderly pattern of brain atrophy magnitudes in childhood goes in tandem with distribution of age related risk factors for brain tissues damage in the course developmental mile stones children growth.
Brain atrophy is paradoxically becoming common in childhood, pressing for the needful adoption and use of quantitative neuro-imaging techniques to attain correct diagnosis and classification of this condition. There is unprecedented significant number of children with childhood brain atrophy such that the current prevalence of pediatric brain atrophy in Northern Tanzania is 16.04% bearing a1:1 male to female ratio. Cerebral Cortical Atrophy is the most prevalent type of brain atrophy in childhood while Brain Hemi-Atrophy is the rarest form of brain atrophy sub-type in the studied population. The under-five children are more vulnerable in developing brain atrophy; hence putting in place programs for early neuro-imaging investigations may revolutionize the current clinical practice in developing countries by virtual of early depiction, grading and mitigation of disease progression into severe forms. The preferential selection of imaging modalities with non-ionizing radiation such as trans-cranial sonography and Magnetic Resonance Imaging stands to be the best consideration in young pediatric age groups.
What is known about this topic
- The brain atrophy is a condition found most commonly in elderly and may however be found in children especially related to malnutrition, head injury and central nervous system infection;
- Most causes of brain atrophy are currently irreversible.
What this study adds
- Pediatric brain atrophy is not uncommon. In the Northern Tanzania a prevalence of 16.04% has been depicted;
- Vulnerability to brain atrophy has been shown to be higher in children under-five years of age;
- Among the subtypes of brain atrophy, the cerebral cortical pattern of atrophy is most prevalent in the studied population.
The authors declare no competing interests.
The corresponding author was the principal researcher who presented the idea, formulated the study plan and conducted most of the field work. The 2nd author contributed for the overall look of the research output. The 3rd author did most of the statistical design and cross checking of the data accuracy. The 4th author contributed in the study feasibility, proposal review and proof reading of the research output. The 5th author was the main supervisor of the whole project and participated in the earliest study design, formulation, proposal review, ethical clearance, field visit and pre-submission review of the research output. All the authors have read and agreed to the final manuscript.
The administration of Arusha Lutheran Medical Center, Agakhan Health center, Afyamax Diagnostic center, Kilimanjaro Christian Medical Center and Siha Polyclinic Tanga for providing accessibility to patients´ data on CT scan examinations.
Table 1: brain dimensional measurements for all children, and correlations of dimensions with age
Figure 1: demographic characteristics of children in cross section survey
Figure 2: gender and age distribution of children in the study: (A) the distribution showing more male children than female in the study population were taken in healthy facilities for brain CT scan examinations; (B) children population in clusters of 5 years intervals showing the over 10 years being the dominant population followed by the under 5 years
Figure 3: the magnitude
of brain atrophy and its sub-types as per three known linear radiologic methods
in Northern Tanzania: (A) the two groups represents (i) children who measured
sulcal width < 2.5mm, ventricular width < 30mm and evans index < 0.3 as children
with normal brain volume; The minor group involved children with higher values
of sulcal width, ventricular width and Evans indices as atrophied brain cases;
(B) Morphological characterization of the patterns of brain volume loss is presented
in total of five forms with their percentage distribution in the studied population
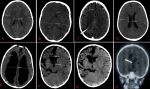
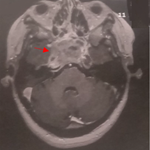
Figure 4: varying brain volumes, normal versus atrophied brain: (A) normal pediatric brain volume showing sulcal width < 2.5mm and Lateral ventricular width < 30mm; (B) normal pediatric brain volume whose distance of the anterior horns of lateral ventricle and the widest diameter gives the Evans Index of 0.2 (normal is < 0.3); (C) global brain atrophy-after long standing hydrocephalus which was shunted then exposing prominent salcal spaces; (D) cortical brain atrophy showing prominent sulci but normal lateral ventricle (< 30mm); (E) global brain atrophy, a post intraventricular hydrocephalus showing prominent lateral ventricular width and sulcal space; a VP shunt is noted at right parieto-occipital junction; (F) brain hemiatrophy showing severe loss of volume in the right hemisphere: Evans index is 0.34; (G) brain hemiatrophy showing prominent sulcal spaces in the right hemisphere (SW > 0.25mm); (H) coronal image of right brain hemiatrophy with ipsilateral congenital megaloncephaly, VP shunt in ventricle
- Gelman BB, Guinto FC. Morphometry, histopathology, and tomography of cerebral atrophy in the acquired immunodeficiency syndrome. Annals of Neurology. 1992;32(1):31-40. PubMed | Google Scholar
- Jernerén F, Elshorbagy AK, Oulhaj A, Smith SM, Refsum H, Smith AD. Brain atrophy in cognitively impaired elderly: the importance of long-chain ω-3 fatty acids and B vitamin status in a randomized controlled trial. Am J Clin Nutr. 2015 Jul;102(1):215-21. PubMed | Google Scholar
- Kumar A, Ram MK, Jaiswal AK. Evaluation of neonates suffered from cerebral edema in birth asphyxia by using transcranial color Doppler. Evaluation. 2018;4(12). Google Scholar
- Kenney D. Inborn Metabolic Diseases: Diagnosis and Treatment, Fifth Edition. Neurology. 2013 Apr 16;80(16):1540-1540. PubMed | Google Scholar
- Yeates KO, Gerhardt CA, Bigler ED, Abildskov T, Dennis M, Rubin KH et al. Peer Relationships of Children with Traumatic Brain Injury. Journal of the International Neuropsychological Society. 2013 May;19(5):518-27. PubMed | Google Scholar
- Chiriboga CA, Fleishman S, Champion S, Gaye-Robinson L, Abrams EJ. Incidence and prevalence of HIV encephalopathy in children with HIV infection receiving highly active anti-retroviral therapy (HAART). The Journal of Pediatrics. 2005 Mar 1;146(3):402-7. PubMed | Google Scholar
- Schueren MAE de van der, Lonterman-Monasch S, Flier WM van der, Kramer MH, Maier AB, Muller M. Malnutrition and Risk of Structural Brain Changes Seen on Magnetic Resonance Imaging in Older Adults. Journal of the American Geriatrics Society. 2016;64(12):2457-63. PubMed | Google Scholar
- Soussain C, Ricard D, Fike JR, Mazeron J-J, Psimaras D, Delattre J-Y. CNS complications of radiotherapy and chemotherapy. The Lancet. 2009 Nov 7;374(9701):1639-51. PubMed | Google Scholar
- Jouvent E, Viswanathan A, Mangin J-F, O´Sullivan Mike, Guichard J-P, Gschwendtner A et al. Brain Atrophy Is Related to Lacunar Lesions and Tissue Microstructural Changes in CADASIL. Stroke. 2007 Jun 1;38(6):1786-90. PubMed | Google Scholar
- Capizzano AA, Ación L, Bekinschtein T, Furman M, Gomila H, Martínez A et al. White matter hyperintensities are significantly associated with cortical atrophy in Alzheimer´s disease. Journal of Neurology, Neurosurgery & Psychiatry. 2004 Jun 1;75(6):822-7. PubMed | Google Scholar
- Zeneroli ML, Cioni G, Vezzelli C, Grandi S, Crisi G, Luzietti R et al. Prevalence of brain atrophy in liver cirrhosis patients with chronic persistent encephalopathy: Evaluation by computed tomography. Journal of Hepatology. 1987 Jan 1;4(3):283-92. PubMed | Google Scholar
- García-Valdecasas-Campelo E, González-Reimers E, Santolaria-Fernández F, De La Vega-Prieto MJ, Milena-Abril A, Sánchez-Pérez MJ et al. Brain atrophy in alcoholics: Relationship with alcohol intake; liver disease; nutritional status, and inflammation. Alcohol Alcohol. 2007 Nov 1;42(6):533-8. PubMed | Google Scholar
- Ge Y, Grossman RI, Babb JS, Rabin ML, Mannon LJ, Kolson DL. Age-Related Total Gray Matter and White Matter Changes in Normal Adult Brain, Part I: Volumetric MR Imaging Analysis. American Journal of Neuroradiology. 2002 Sep 1;23(8):1327-33. PubMed | Google Scholar
- Faden AI, Wu J, Stoica BA, Loane DJ. Progressive inflammation-mediated neurodegeneration after traumatic brain or spinal cord injury. British Journal of Pharmacology. 2016 Feb 1;173(4):681-91. PubMed | Google Scholar
- Lukas C, Minneboo A, Groot V de, Moraal B, Knol DL, Polman CH et al. Early central atrophy rate predicts 5 year clinical outcome in multiple sclerosis. Journal of Neurology, Neurosurgery & Psychiatry. 2010 Dec 1;81(12):1351-6. PubMed | Google Scholar
- Kochunov P, Mangin J-F, Coyle T, Lancaster J, Thompson P, Rivière D et al. Age-related morphology trends of cortical sulci. Human Brain Mapping. 2005;26(3):210-20. PubMed | Google Scholar
- Kabat J, Król P. Focal cortical dysplasia - review. Pol J Radiol. 2012;77(2):35-43. PubMed | Google Scholar
- Shrestha RK, Sedain G, Shilpakar SK. Hemiatrophy of the brain: a report of two cases. JSSN. 2015;18(1):26-8.
- Sirén A-L, Radyushkin K, Boretius S, K�mmer D, Riechers C-C, Natt O et al. Global brain atrophy after unilateral parietal lesion and its prevention by erythropoietin. Brain. 2006 Feb 1;129(2):480-9. PubMed | Google Scholar
- Ygberg S, Nilsson A. The developing immune system - from foetus to toddler. Acta Paediatrica. 2012;101(2):120-7. PubMed | Google Scholar
- Aravalli RN, Peterson PK, Lokensgard JR. Toll-like Receptors in Defense and Damage of the Central Nervous System. J Neuroimmune Pharmacol. 2007 Dec 1;2(4):297-312. PubMed | Google Scholar
- Kullak W, Sobaniec W. Risk factors and prognosis of epilepsy in children with cerebral palsy in north-eastern Poland. Brain and Development. 2003 Oct 1;25(7):499-506. PubMed | Google Scholar
- Ghosh A, Wilde EA, Ghosh A, Wilde EA, Hunter JV, Bigler ED et al. The relation between Glasgow Coma Scale score and later cerebral atrophy in paediatric traumatic brain injury. Brain Injury. 2009 Jan 1;23(3):228-33. PubMed | Google Scholar
- Bruns J, Hauser WA. The Epidemiology of Traumatic Brain Injury: A Review. Epilepsia. 2003;44(s10):2-10. PubMed | Google Scholar
- Peper JS, Brouwer RM, Schnack HG, van Baal GC, van Leeuwen M, van den Berg SM et al. Sex steroids and brain structure in pubertal boys and girls. Psychoneuroendocrinology. 2009 Apr 1;34(3):332-42. PubMed | Google Scholar
- Birge SJ. The use of estrogen in older women. Clinics in Geriatric Medicine. 2003 Aug 1;19(3):617-27. PubMed | Google Scholar
- Sohrabji F. Estrogen-IGF-1 interactions in neuroprotection: Ischemic stroke as a case study. Frontiers in Neuroendocrinology. 2015 Jan 1;36:1-14. PubMed | Google Scholar
- Stein DG. Progesterone exerts neuroprotective effects after brain injury. Brain Research Reviews. 2008 Mar 14;57(2):386-97. PubMed | Google Scholar
- Deoni SCL, Mercure E, Blasi A, Gasston D, Thomson A, Johnson M i>et al. Mapping Infant Brain Myelination with Magnetic Resonance Imaging. J Neurosci. 2011 Jan 12;31(2):784-91. PubMed | Google Scholar
- McMillen R, Pitcher B. The balancing act: body fluids and protecting patient health. British Journal of Healthcare Assistants. 2011 Mar 1;5(3):117-21. PubMed | Google Scholar
- Duning T, Kloska S, Steinstr�ter O, Kugel H, Heindel W, Knecht S. Dehydration confounds the assessment of brain atrophy. Neurology. February 08, 2005; 64(3). PubMed | Google Scholar
- Akinyinka OO, Adeyinka AO, Falade AG. The computed axial tomography of the brain in protein energy malnutrition. Annals of Tropical Paediatrics. 1995 Dec 1;15(4):329-33. PubMed | Google Scholar
- Coppen EM, Jacobs M, van den Berg-Huysmans AA, van der Grond J, Roos RAC. Grey matter volume loss is associated with specific clinical motor signs in Huntington´s disease. Parkinsonism & Related Disorders. 2018 Jan 1;46:56-61. PubMed | Google Scholar
- Silvennoinen HM, Hamberg LM, Valanne L, Hunter GJ. Increasing Contrast Agent Concentration Improves Enhancement in First-Pass CT Perfusion. American Journal of Neuroradiology. 2007 Aug 1;28(7):1299-303. PubMed | Google Scholar
- Thakkar PA, Dave RH. Dyke-Davidoff-Masson syndrome: A rare cause of cerebral hemiatrophy in children. Journal of Pediatric Neurosciences. 2016 Sep;11(3):252. PubMed | Google Scholar
- Atalar MH, Icagasioglu D, Tas F. Cerebral hemiatrophy (Dyke-Davidoff-Masson syndrome) in childhood: Clinicoradiological analysis of 19 cases. Pediatrics International. 2007 Feb 1;49(1):70-5. PubMed | Google Scholar
- Hayakawa K, Kanda T, Yamori Y. Unilateral cerebral polymicrogyria with ipsilateral cerebral hemiatrophy. Eur Radiol. 2002 Oct 1;12(10):2542-7. PubMed | Google Scholar
- Kitagaki H, Mori E, Ishii K, Yamaji S, Hirono N, Imamura T. CSF spaces in idiopathic normal pressure hydrocephalus: morphology and volumetry. American Journal of Neuroradiology. 1998 Aug 1;19(7):1277-84. PubMed | Google Scholar
- Peters R. Ageing and the brain. Postgraduate Medical Journal. 2006 Feb 1;82(964):84-8. PubMed | Google Scholar
- Muola D. Prevalence and pattern of white matter abnormalities in adult patients referred for brain magnetic resonance imaging at Muhimbili national hospital. Muhimbili University of Health and Allied Sciences. 2017 [cited 2019 Sep 13].
- Appelman APA, Exalto LG, Graaf Y van der, Biessels GJ, Mali WPTM, Geerlings MI. White Matter Lesions and Brain Atrophy: More than Shared Risk Factors? A Systematic Review. CED. 2009;28(3):227-42. PubMed | Google Scholar
- Zivadinov R, Grop A, Sharma J, Bratina A, Tjoa CW, Dwyer M et al. Reproducibility and Accuracy of Quantitative Magnetic Resonance Imaging Techniques of Whole-Brain Atrophy Measurement in Multiple Sclerosis. Journal of Neuroimaging. 2005;15(1):27-36. PubMed | Google Scholar
- Obajimi MO, Fatunde OJ, Ogunseyinde AO, Omigbodun OO, Atalabi OM, Joel RU. Computed tomography and childhood seizure disorder in Ibadan. West African Journal of Medicine. 2004 Jan 1;23(2):167-172-172. PubMed | Google Scholar
- Raz N, Gunning-Dixon F, Head D, Rodrigue KM, Williamson A, Acker JD. Aging, sexual dimorphism, and hemispheric asymmetry of the cerebral cortex: replicability of regional differences in volume. Neurobiology of Aging. 2004 Mar 1;25(3):377-96. PubMed | Google Scholar
- Hatazawa J, Ito M, Yamaura H, Matsuzawa T. Sex Difference in Brain Atrophy During Aging: A Quantitative Study with Computed Tomography. Journal of the American Geriatrics Society. 1982;30(4):235-9. PubMed | Google Scholar
- Espeland MA, Bryan RN, Goveas JS, Robinson JG, Siddiqui MS, Liu S et al. Influence of Type 2 Diabetes on Brain Volumes and Changes in Brain Volumes: Results from the Women´s Health Initiative Magnetic Resonance Imaging Studies. Diabetes Care. 2013 Jan 1;36(1):90-7. PubMed | Google Scholar
- Zahr NM, Kaufman KL, Harper CG. Clinical and pathological features of alcohol-related brain damage. Nature Reviews Neurology. 2011 May;7(5):284-94. PubMed | Google Scholar
- Burd I, Balakrishnan B, Kannan S. Models of Fetal Brain Injury, Intrauterine Inflammation, and Preterm Birth. American Journal of Reproductive Immunology. 2012;67(4):287-94. PubMed | Google Scholar
- Zimmerman RA, Bilaniuk LT, Bruce D, Schut L, Uzzell B, Goldberg HI. Computed Tomography of Craniocerebral Injury in the Abused Child. Radiology. 1979 Mar 1;130(3):687-90. PubMed | Google Scholar
- Pinto PS, Meoded A, Poretti A, Tekes A, Huisman TAGM. The Unique Features of Traumatic Brain Injury in Children. Review of the Characteristics of the Pediatric Skull and Brain, Mechanisms of Trauma, Patterns of Injury, Complications, and their Imaging Findings-Part 2. Journal of Neuroimaging. 2012;22(2):e18-41. PubMed | Google Scholar
- Smith DH, Chen X-H, Pierce JES, Wolf JA, Trojanowski JQ, Graham DI et al. Progressive Atrophy and Neuron Death for One Year Following Brain Trauma in the Rat. Journal of Neurotrauma. 1997 Oct 1;14(10):715-27. PubMed | Google Scholar
- Case ME, Graham MA, Handy TC, Jentzen JM, Monteleone JA, Syndrome NA of MEAHC on SB. Position Paper on Fatal Abusive Head Injuries in Infants and Young Children. The American Journal of Forensic Medicine and Pathology. 2001 Jun;22(2):112. PubMed | Google Scholar
Search
This article authors
On Pubmed
On Google Scholar
Citation [Download]
Navigate this article
Similar articles in
Key words
Tables and figures

Article metrics
Recently from the PAMJ


Authors´ services
