
Risk factors for hypertension among young adults (18-35) years attending in Tenwek Mission Hospital, Bomet County, Kenya in 2018
Damaris Ogake Ondimu, Gideon Mutie Kikuvi, Walter None Otieno
Corresponding author: Damaris Ogake Ondimu, Institute of Tropical Medicine, Jomo Kenyatta University of Agriculture and Technology, Nairobi, Kenya 
Received: 12 Feb 2019 - Accepted: 05 Jul 2019 - Published: 16 Jul 2019
Domain: Chronic disease prevention
Keywords: Risk factors, hypertension, young adults, cases
©Damaris Ogake Ondimu et al. Pan African Medical Journal (ISSN: 1937-8688). This is an Open Access article distributed under the terms of the Creative Commons Attribution International 4.0 License (https://creativecommons.org/licenses/by/4.0/), which permits unrestricted use, distribution, and reproduction in any medium, provided the original work is properly cited.
Cite this article: Damaris Ogake Ondimu et al. Risk factors for hypertension among young adults (18-35) years attending in Tenwek Mission Hospital, Bomet County, Kenya in 2018. Pan African Medical Journal. 2019;33:210. [doi: 10.11604/pamj.2019.33.210.18407]
Available online at: https://www.panafrican-med-journal.com//content/article/33/210/full
Original article 
Risk factors for hypertension among young adults (18-35) years attending in Tenwek Mission Hospital, Bomet County, Kenya in 2018
Risk factors for hypertension among young adults (18-35) years attending in Tenwek Mission Hospital, Bomet County, Kenya in 2018
Damaris Ogake Ondimu1,&, Gideon Mutie Kikuvi1, Walter None Otieno2
1Institute of Tropical Medicine, Jomo Kenyatta University of Agriculture and Technology, Nairobi, Kenya, 2Maseno University, School of Medicine, Maseno, Kenya
&Corresponding author
Damaris Ogake Ondimu, Institute of Tropical Medicine, Jomo Kenyatta University
of Agriculture and Technology, Nairobi, Kenya
Introduction: hypertension ranks third in the world, after underweight and unsafe sex, in the list of six major risk factors contributing to the global disease. In Kenya, the prevalence stands at 24% in the general population, while among the young adults, the incidence of hypertension has been reported to be in the rise; a fact attributed to increased number of risks. We therefore sought to determine awareness and risk factors of hypertension among young adults attending Tenwek hospital.
Methods: a case-control study of young adults ages 18-35, involving 80 cases and 80 controls at Tenwek Mission Hospital, Bomet County. Cases included males and females newly diagnosed with hypertension (diagnosed at the time of data collection) and if they reported taking antihypertensive medication and reported as hypertensives in the hospital records at any clinic visit or at interview, while controls included persons with no history of hypertension.
Results: those having a BMI ≥ 25 were 3.05 times more likely to be hypertensive (OR: 3.05, 95% CI 1.26, 7.40; p=0.014). Having a relative suffering from hypertension increased almost thrice the odds of being hypertensive (OR: 2.78, 95% CI 1.20, 6. 46; p= 0.018). Not drinking alcohol reduced the chance of suffering from hypertension by 70%, (OR=0.30, 95% CI 0.11, 0.81; p= 0.017).
Conclusion: the prevalence of hypertension in younger adults is not as low as generally perceived. Preventive measures should be formulated in a manner to address variety of major risk factors in young adults.

Hypertension, also called high blood pressure, is a condition that arises when the body's smaller blood vessels (the arterioles) narrow, causing the blood to exert excessive pressure against the vessel walls and forcing the heart to work harder to maintain the pressure [1]. Usually hypertension is described as a systolic blood pressure (SBP) of 140 mm Hg or more, or a diastolic blood pressure (DBP) of 90 mm Hg or more [2]. Blood pressure for adults aged 18 years or older can be classified as follows; normal: systolic lower than 120 mm Hg, diastolic lower than 80 mm Hg, prehypertension: systolic 120-139 mm Hg, diastolic 80-89 mm Hg, stage 1: systolic 140-159 mm Hg, diastolic 90-99 mm Hg, stage 2: systolic 160 mm Hg or greater, diastolic 100 mm Hg or greater [3]. Various physiological changes occur including atherosclerosis and vascular changes that occur with aging are responsible for most occurrence of hypertension in the older populations. Therefore advanced age has been associated with increasing incidences of hypertension [4-6]. Global prevalence of hypertension is 31%. It has been estimated that premature deaths resulting from hypertension annually are approximately 7.1 million, which account for 64 million Disability-Adjusted Life Years (DALYs) [7]. Hypertension ranked third in the world, after underweight and unsafe sex, in the list of six major risk factors contributing to the global disease burden [8]. In Kenya the prevalence stands at 24% of the population [7]. Young adult comprises of 35% of Kenyan population (Kenya National Bureau Of statistics (KNBS) 2009 census). National Institute of Health (NIH) in a global multicentre study found out that there are 19% young adults with hypertension than previously believed. The new study which took blood pressure readings of 14,000 men and women aged between 24 and 32 years revealed a higher percentage of high blood pressure readings than results from previous studies [9]. Hypertension has become a public health concern in sub-Saharan Africa; Kenya included [10-12]. It is also a major non-infective factor in the high mortality of adults in sub-Saharan Africa [13]. The risk factors for hypertension are increasing in rural and urban populations [14]. These risk factors include smoking, alcohol intake and sedentary lifestyles. Further, cross-sectional studies have only demonstrated weak health care systems as the major and sole factor responsible for the observed rising incidence of hypertension within the young population in rural settings in Africa [15]. Therefore, this study sought to find the risk factors of hypertension among young adults within the catchment of Tenwek Mission Hospital.

This was case control study in which young adults, ages between 18-35 years attending in Tenwek Mission Hospital were eligible for the study. Tenwek is in Bomet County, lies between latitudes 0� 29' and 1� 03' south and between longitudes 35� 05' and 35� 35' east. It is Christian mission hospital offering primary healthcare to a population of about 800,000 and a surgery center for a region of more than 8.5 million people. The researcher and research assistant visited the health facility every day during the one month period of the survey to meet the sample size recommended in the study. Patients walked into the clinic, their clinical records were examined to assess their eligibility.
�
Case definition: individuals were classified as cases at the time of visit if they had a systolic blood pressure ≥140 mm Hg or a diastolic blood pressure ≥90 mm Hg on at least two clinic visits or if they reported taking antihypertensive medication at any clinic visit or at interview. Controls were defined as other patients attending the same outpatient service with no prior history of hypertension and the blood pressure was normal on the date of interview.�
Sample size determination: with the proportion of those exposed in the control group being 24% from the literature [7]. We sought to know the minimum sample size sufficient to detect an odds-ratio of 2.7 or greater. We assumed 80% statistical power, with equal number of cases and controls (r=1). The Fleiss formula (Fleiss, 1981) for calculating sample size for case control studies was used.
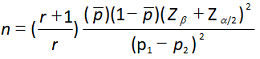
For 80% power, Zβ=.84 For 0.05 significance level, Zα=1.96 r=1 (equal number of cases and controls). The proportion exposed in the control group is 24%. To get proportion of cases exposed n=2*(0.32)(1-0.32)*(0.84+1.96)^2/(0.45-0.24)^2 =3.412/0.441=70.49. When we factor in 10% refusal or spoilt questionnaires, the minimum sample size required = 78 for each group. We therefore recruited a total of 160 respondents both male and female aged between 18-35 consisting of 80 cases and 80 controls were studied.
�
Data management and analysis: the questionnaires were administered by the interviewer after explaining the purpose of study and obtaining an informed consent. Completed questionnaires were received, checked for completeness and entered using Access forms. Data cleaning and analysis was done using STATA version 14.1 (STATA Corporation, College Station, Texas, USA). The overall socio-demographic characteristic of the study population was analyzed using frequencies and proportions. Prior to analysis, some variables were recoded, collapsed and others combined. For example, highest education level attained was re-recoded combining tertiary with university because of the low number in those categories. Those who refused to answer a specific question "refused to answer" or answered, "Don't know" were set to missing where necessary in order to exclude them from the analysis. Those who answered "Don't know" for the question "Are you currently on medication?" were set to missing in order to exclude them from the analysis. Pearson's Chi-square or Fisher's exact test were used to test for the association between the hypertension and categorical variables. Unconditional logistic regression was fitted to find out risk factors of hypertension. We fitted both the unadjusted and adjusted model. All covariates with p-value ≤ 0.1 or set a prior were included in the adjusted model. All estimates were done at 5% level of significance.
Socio-demographic characteristics of the study participants: the highest percentage of respondents were in the age group of 30-35 years which comprised of cases and controls (60% vs. 40.3% respectively; p < 0.041). Seventy one percent of the respondents resided in the rural area. Six two percent (62%) respondents reported having acquired secondary and tertiary level of education. Majority of respondents (71.5%) were married. Majority (53%) reported earning some income and 42% of respondents earned an average monthly income of none or less than Ksh 10,000 (Table 1).
�
Inferential data analysis�
Known risk factors of hypertension: among the known risk factors (alcohol, obesity, smoking and family history), only obesity and family history were statistically significant in this study (Table 2).�
Lifestyle risk factors of hypertension: Table 3 shows the bivariate analysis of lifestyle risk factors of hypertension. Frequency of eating red meat and alcohol consumption increased the risk of developing hypertension. The risk of hypertension tends to increase with frequency of eating red meat. Those who reported not eating red meat at all had 77% less chance of being hypertensive compared to those reporting 1 to 2 times a week (OR=0.23, 95% CI 0.07, 0.70; p=0.010), whereas those respondents reporting eating red meat once were 71% less likely to be hypertensive (OR=0.29, 95% CI 0.12, 0.69; p=0.010) Table 4. In the multivariable analysis, participants who reported not eating red meat at all had 83% less chance of being hypertensive compared to those reporting 1 to 2 times a week (OR=0.17, 95% CI 0.04, 0.64; p=0.012), whereas those respondents reporting eating red meat once per week had 72% less chance to be hypertensive (OR=0.28, 95% CI 0.10, 0.74; p=0.011). Those having a BMI ≥ 25 were 3.05 times more likely to be hypertensive (OR: 3.05, 95% CI 1.26, 7.40; p=0.014). Having a relative suffering from hypertension increased almost thrice the odds of being hypertensive (OR: 2.78, 95% CI 1.20, 6. 46; p=0.018). Not drinking alcohol reduced the chance of suffering from hypertension by 70%, (OR=0.30, 95% CI 0.11, 0.81; p=0.017).
Although age did not remain significant in the final multivariable analysis, it emerged as stronger demographic risk factor for hypertension in the bivariate; especially those between the age group of 30-35 years of age. The study findings suggest that hypertension is more prevalent in the rural areas (69.3%) as opposed to urban area (14%). This finding contrasts with numerous studies showing a higher prevalence of hypertension in urban African [16]. More than a half of cases reported earning average monthly income of none or less than Ksh 10,000. There was higher number of hypertension(cases) reported in this income brackets (43.6%) as compared to people with higher income (23.8%) which was not statistically significant (p=0.51). Numerous indices of Social Economic Status (SES) have been studied, stating that SES can be highly variable over time, particularly with regard to income, and it appears that blood pressure level may be sensitive to these fluctuations [15, 17]. Being obese (BMI≥25), frequently eating red meat, having any relative who suffer from hypertension and drinking of alcohol are associated risk factors of hypertension [18]. Non-alcohol drinkers had nearly 70% less chance of suffering from hypertension, compared to those who drank alcohol. There was also a direct relationship between current smoking and hypertension. Smokers were 1.82, (CI 0.75-4.42) higher chance of being hypertensive and wasn't statistically significant. This study conforms with a study of social habits such as smoking, alcohol consumption and physical inactivity, higher anthropometric parameters (BMI and WHR) and diet rich in red meat and low in fruit was associated with hypertension among Kenya defense forces [16, 19].
The study has shown that hypertension among the young adult is not as low as earlier perceived. Obesity and unhealthy lifestyle behaviors e.g. alcohol use and high meat consumption emerged as the main risk factors in the study population. This appeals for more focused studies for this age group that involves reappraisal on the major aspects of hypertension in young adults, promoting interest and discussions among relevant authorities.
What is known about this topic
- Most studies have reported age as a stronger demographic risk factor for hypertension, with a direct correlation between advanced age and the risk of developing hypertension;
- However, there is paucity of data regarding actual prevalence of hypertension in young adults.
What this study adds
- This study showed that prevalence of hypertension in younger adults is not as low as generally perceived. These findings appeals for reappraisal of risk factors of hypertension among young adults.
The authors declare no competing interests.
Damaris Ogake Ondimu developed the concept and the design of the study, data collection, analysis of the data, and drafted study reports. Prof. Gideon Mutie Kikuvi and Dr. Walter None Otieno provided academic guidance and continuous supervision, reviewed the study reports and manuscript.
I start by thanking the Almighty for granting me life in my research period. I would like to express my sincere appreciation to all individuals whose cooperation and assistance was crucial for the successful completion of this study. I owe an immense debt of gratitude to my supervisors, Prof. Gideon Kikuvi and Dr. Walter Otieno, my lecturer Mrs. Caro Musita for their engaged guidance and spinning encouragement towards my study. I thank my research assistants who exercised high skills in obtaining the results and guiding the respondents by all means to get the best responses. I also wish to thank the Tenwek fraternity who built trust and allowed me to take the full charge of the patients to attain my objectives. My gratitude is also extended to all my respondents for their cooperation and time.
Table 1: socio-demographic characteristic of the study population (N=152)
Table 2: the distribution of the known hypertension risk factors across cases and controls
Table 3: bivariate analysis of lifestyle risk factors of hypertension
Table 4: multivariate analysis of socio-demographics and socio-economic risk factors of hypertension
- Winters L. Hypertension. Encyclop�dia Britannica: Encyclop�dia Britannica, inc. 2014.
- Bisognano JD, Kaufman CL, Bach DS, Lovett EG, de Leeuw P, DEBuT-HT and Rheos. Feasibility trial investigators. Improved cardiac structure and function with chronic treatment using an implantable device in resistant hypertension: results from European and United States trials of the Rheos system. J Am Coll Cardiol. 2011 Apr 26; 57(17): 1787-8. PubMed | Google Scholar
- Alexander M, Courtois F. Blood pressure during sexual activity after spinal cord injury inaccurately portrayed. J Neurotrauma. 2017 Mar 15; 34(6): 1289-90. PubMed | Google Scholar
- Xuming D. Cardiovascular physiology in the older adults. Journal of Giriatric Cardiology. 2015; 12(3): 196-201. PubMed | Google Scholar
- Barregard L, Bonde E, Ohrstrom E. Risk of hypertension from exposure to road traffic noise in a population-based sample. Occup Environ Med. 2009 Jun; 66(6): 410-5. PubMed | Google Scholar
- Jenson A, Omar AL, Omar MA, Rishad AS, Khoshnood K. Assessment of hypertension control in a district of Mombasa, Kenya. Glob Public Health. 2011; 6(3): 293-306. PubMed | Google Scholar
- Tecla Temu M, Ehete Bahiru, Fredrick Bukachi, Gerald Bloomfield S, Peter Muiruri, Carey Farquh. Lay beliefs about hypertension among HIV-infected adults in Kenya. BMJ. 2017. Google Scholar
- Ezzati M, Lopez AD, Rodgers A, Vander Hoorn S, Murray CJ, Comparative Risk Assessment Collaborating Group. Selected major risk factors and global and regional burden ofdisease. Lancet. 2002 Nov 2; 360(9343): 1347-60. PubMed | Google Scholar
- Quynh Nguyen C, Joyce Tabor W, Pamela Entzel P, Yan Lau, Chirayath Suchindran, Jon Hussey M et al. Discordance in national estimates of hypertension among young adults. chapel hill: UNC Gillings School of Global Public Health, Chapel Hill NC 27514. Epidemiology. 2011 Jul; 22(4): 532-541. PubMed | Google Scholar
- Hendriks ME, Wit FW, Roos MT, Brewster LM, Akande TM, de Beer IH et al. Hypertension in sub-saharan Africa: cross-sectional surveys in four rural and urban communities. PLoS One. 2012; 7(3): e32638. PubMed | Google Scholar
- Adeloye D, Basquill C. Estimating the prevalence and awareness rates of hypertension in Africa: a systematic analysis. PLoS One. 2014; 9(8): e104300. PubMed | Google Scholar
- van de Vijver S, Akinyi H, Oti S, Olajide A, Agyemang C, Aboderin I et al. Status report on hypertension in Africa-consultative review for the 6th Session of the African Union Conference of Ministers of Health on NCD's. Pan Afr Med J. 2013; 16: 38. PubMed | Google Scholar
- Fastone Goma M, Selestine Nzala H, Olusegun Babaniyi, Peter Songolo, Cosmos Zyaambo, Emmanuel Rudatsikira et al. Prevalence of hypertension and its correlates in Lusaka urban district of Zambia: a population based survey. Lusaka Zambia: International Archives of Medicine. 2011; 4: 34. PubMed | Google Scholar
- Mathenge W, Foster A, Kuper H. Urbanization, ethnicity and cardiovascular risk in a population in transition in Nakuru, Kenya: a population-based survey. BMC Public Health. 2010 Sep 22; 10: 569. PubMed | Google Scholar
- Hendriks ME, Wit FW, Roos MT, Brewster LM, Akande TM, de Beer IH et al. Hypertension in sub-Saharan Africa: cross-sectional surveys in four rural and urban communities. PLoS One. 2012; 7(3): e32638. PubMed | Google Scholar
- Damasceno A, Azevedo A, Silva-Matos C, Prista A, Diogo D, Lunet N. Hypertension prevalence, awareness, treatment and control in mozambique: urban/rural gap during epidemiological transition. Hypertension. 2009 Jul; 54(1): 77-83. PubMed | Google Scholar
- Steptoe A, Brydon L, Kunz-Ebrecht S. Changes in financial strain over three years, ambulatory blood pressure and cortisol responses to awakening. Psychosom Med. 2005 Mar-Apr; 67(2): 281-7. PubMed | Google Scholar
- Wang L, Manson JE, Buring JE, Sesso HD. Meat intake and the risk of hypertension in middle-aged and older women. J Hypertens. 2008 Feb; 26(2): 215-22. PubMed | Google Scholar
- Black HR, Ming S, Poll DS, Wen YF, Zhou HY, Zhang ZQ. A comparison of the care of hypertension in Hunan and Connecticut. J Clin Hypertens. 1986 Mar; 2(1): 79-88. PubMed | Google Scholar
Search
This article authors
On Pubmed
On Google Scholar
Citation [Download]
Navigate this article
Similar articles in
Key words
Tables and figures

Article metrics
Recently from the PAMJ


Authors´ services
